
Ask ten metabolic researchers why an animal lost weight and you will likely hear about food intake first. Energy expenditure, the other half of the equation, usually appears as an afterthought, if it is measured at all. That gap matters. Weight change is the net result of two moving parts, and without a measured expenditure value you cannot tell which one moved. This article covers how to build an energy expenditure obesity model around glucagon receptor (GCGR) agonism, which calorimetry platform fits which question, and where paired studies usually go wrong.
Table of Contents
- Quick Takeaways
- Why Energy Expenditure Is the Hardest Variable to Measure
- How GCGR Agonism Changes the Energy Budget
- Comparing Calorimetry Approaches
- Glucagon Fat Oxidation Assay Design
- Study Design Controls for Paired Assays
- Normalizing Energy Expenditure Data
- Common Mistakes in Paired Studies
- Sourcing and Documenting Research Compounds
- Frequently Asked Questions
- References
Quick Takeaways
| Key Insight | Explanation |
|---|---|
| Measure expenditure and intake in the same animals | Weight curves cannot separate reduced intake from higher expenditure. Run indirect calorimetry and food intake logging on the same cohort, at the same time. |
| Treat GCGR agonism as a substrate question | Glucagon signalling is linked to fatty acid oxidation and ketone production in the literature, so expect shifts in respiratory exchange ratio, not just total kcal/h. |
| Acclimate animals before recording | Animals moved into metabolic cages need a settling period. Without one, early data mostly record handling stress and novelty. |
| Normalize to lean mass and state the method | Raw kcal/h is confounded by body size. Choose an ANCOVA with a lean mass covariate or allometric scaling, then report exactly which one you used. |
| Match the platform to the question | Open-circuit systems suit steady-state expenditure. Continuous home-cage phenotyping is better for circadian and activity-linked changes. |
| Pair-feed a control group | A pair-fed arm separates the intake effect from any direct effect of GCGR activation on expenditure and substrate use. |
| Document the compound lot end to end | Batch-level certificates of analysis, Chain of Custody records and reconstitution logs are what make paired results reproducible across labs. |
Why Energy Expenditure Is the Hardest Variable to Measure
Most obesity models report body weight, food intake and sometimes fat mass. Energy expenditure needs more equipment, more labour and more careful analysis, so it gets dropped. That is a design choice with consequences, because a compound that changes weight through expenditure looks identical to one that changes weight through appetite until you measure both.
Why body weight alone misleads
Two animals can gain the same grams over four weeks for entirely different reasons. One may eat more and burn the same energy, while the other eats the same and burns less. A scale cannot distinguish those cases, and a glucagon-active compound can shift the balance in ways that are invisible to weighing alone.
In practice, many paired studies present a clean weight curve with a confident interpretation and no expenditure data behind it. Reviewers tend to ask the same question every time: was the effect on intake, on expenditure, or on how nutrients are partitioned between fat and lean tissue?
The energy balance model is a starting point
The dominant framing holds that a positive energy balance drives weight gain and a negative balance drives loss. A 2025 review of the human energy balance restates that model and then looks for what it leaves out. The lesson for animal work is simple: the model tells you which numbers to collect, not what they will show.
Löffler and colleagues' 2021 review treats energy expenditure as a therapeutic lever, with explicit attention to the organs involved in metabolic control and a path running from preclinical models to clinical application. That framing is useful for obesity researchers because it treats expenditure as something to measure in the animal first, rather than infer from body weight.
How GCGR Agonism Changes the Energy Budget
Retatrutide is a triple agonist at the GIP, GLP-1 and glucagon receptors. The incretin arms of that profile explain why the compound is so widely studied, but the glucagon arm is what makes it a useful probe for energy expenditure. Glucagon acts principally on the liver and on fat tissue, so its effects are metabolic rather than simply appetite-related.
What glucagon adds to incretin signalling
A 2025 article by A. Gastaldelli in the Journal of Hepatology describes glucagon enhancing fatty acid oxidation and ketone production while reducing lipogenesis. That is a substrate-level story, and it predicts something specific: the signal should show up in how the animal burns fuel, not only in how much it eats.
Y. Wu and colleagues' 2024 study examined glucagon's metabolic actions across mouse models of obesity, fatty liver disease and type 2 diabetes. The title itself flags variability across models. A GCGR effect that looks robust in one background can look muted in another, which is why the model choice belongs in the design section, not as an afterthought.
D. C. D. Hope's 2021 Frontiers in Endocrinology article on GLP-1 and glucagon co-agonism makes a related point about balance. Relative potency at the two receptors determines which effect dominates, so an observed outcome cannot be attributed to glucagon activity without checking the receptor balance of the compound you are testing.
Expected shifts in expenditure and substrate use
A GCGR-active compound should, in principle, push respiratory exchange ratio (RER) downward, reflecting greater fat oxidation relative to carbohydrate. Total energy expenditure may rise, but it may not, and the answer depends on whether intake and activity were controlled. Treat a single rise in kcal/h as a hypothesis, not a conclusion.
Expenditure data from a glucagon-active compound is not one number to read off a chart. It is a pattern across intake, substrate use and activity, and it only becomes interpretable when all three are recorded together.
A common mistake is to see higher heat production and call it thermogenesis without checking locomotor activity. An animal that moves more will burn more, and the calorimetry trace will look like a metabolic effect even when the driver is behavioural.
Comparing Calorimetry Approaches
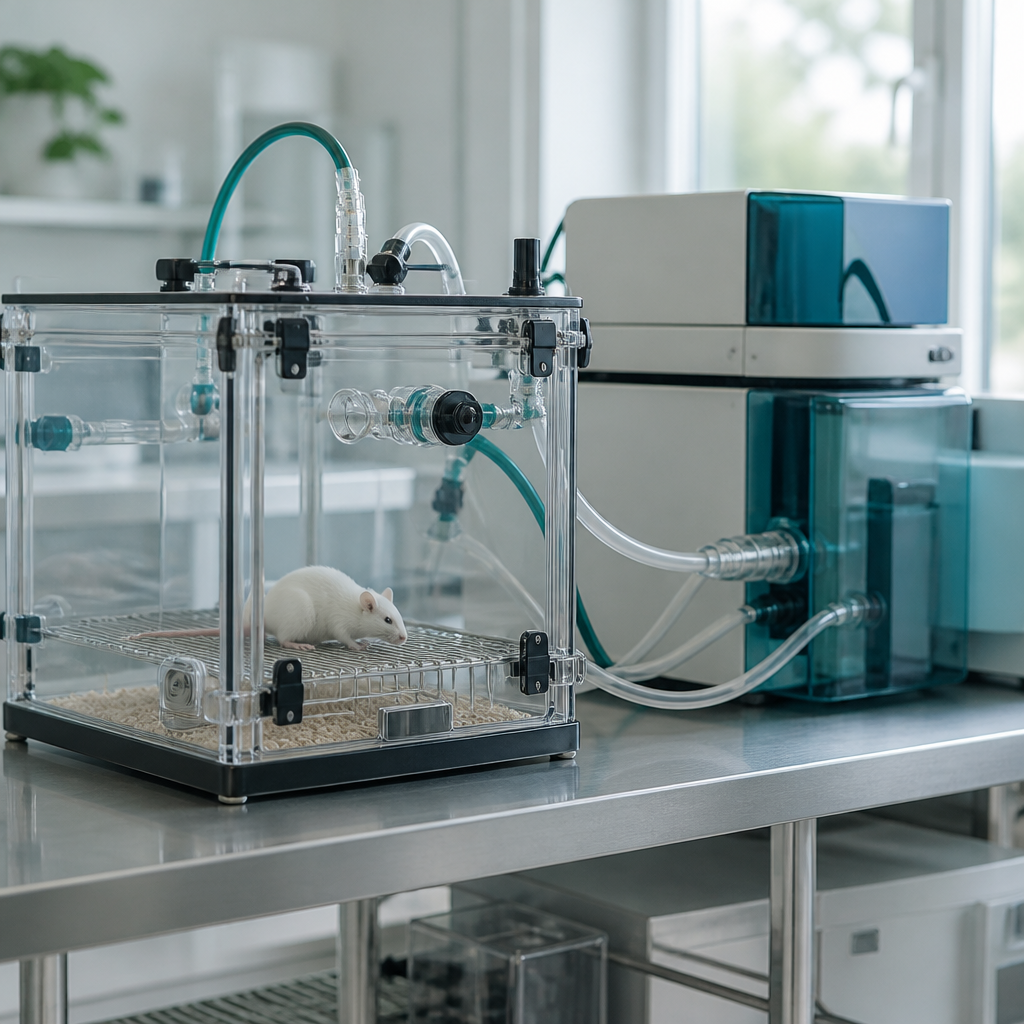
Three approaches cover most energy expenditure work in obesity models, and each answers a different question. Open-circuit indirect calorimetry measures oxygen consumption and carbon dioxide production, from which expenditure and RER are calculated. Continuous home-cage phenotyping adds activity and feeding resolution over days. Isotope-based methods estimate total expenditure over longer windows, and a 2017 review of measurement methods for physical activity and energy expenditure is a useful overview of their trade-offs.
Where each method earns its keep
Open-circuit systems are the workhorse for steady-state expenditure and substrate questions. They are sensitive to calibration drift and to chamber flow settings, so run gas calibration before every session and log the flow rate. Home-cage systems trade some precision for continuity, which makes them better at showing when during the light-dark cycle a change occurs.
| Approach | Best fit for paired GCGR studies | Main limitation |
|---|---|---|
| Open-circuit indirect calorimetry in metabolic cages | Steady-state expenditure and RER after GCGR activation, with food intake logged in the same chamber | Short recording windows, sensitive to handling and calibration drift, requires acclimation time |
| Continuous home-cage phenotyping with activity monitoring | Circadian patterns, activity-linked expenditure changes and feeding bouts over several days | Lower precision per measurement and limited resolution for fine substrate calculations |
| Isotope-based total energy expenditure estimates | Integrated expenditure over long windows when behavioural confounds are a concern | Expensive, integrates over days so it cannot show time-of-day effects, and needs specialist analysis |
Choosing by question, not by catalogue
If your hypothesis is about fat oxidation, open-circuit RER is the minimum. If your hypothesis is about activity, you need continuous monitoring, and if it is about the total daily budget, isotope methods earn their cost. Most failed studies we have seen picked the platform the lab already owned, then tried to answer a question it could not support.
Glucagon Fat Oxidation Assay Design
A glucagon fat oxidation assay can be run at two levels. Whole-animal RER tells you what the organism is doing. In vitro fatty acid oxidation assays in hepatocytes or other cultured cells tell you whether the receptor signal reaches the substrate machinery directly. Both are useful, but they answer different questions, and a whole-animal result cannot be proven by a cell assay or the reverse.
Because our own work at Pepura Labs focuses on in vitro research applications, we see many teams start at the cell level and then ask whether the effect survives in a whole organism. That is a sensible order. Run the cell assay first to confirm receptor-level activity in your system, then move to calorimetry to test whether the effect survives physiology.
Choosing the fat oxidation readout
Pick one primary readout before the study starts. For whole-animal work, that is usually RER over a defined window, with total fat oxidation estimated from the calorimetry calculations. For cell-based assays, choose a labelled substrate and a measurement window that matches your receptor exposure time, then keep both fixed across the paired arms.
Avoid stacking several fat oxidation endpoints and reporting the one that looks best. Report one primary endpoint, list secondary endpoints separately, and state the analysis window in the methods. That discipline matters more than any single assay choice.
Interpreting respiratory exchange ratio with care
RER values near 0.7 generally indicate predominantly fat oxidation, while values approaching 1.0 indicate predominantly carbohydrate oxidation. Those reference points are standard in indirect calorimetry, but a shift in RER can also reflect feeding state, meal timing and fasting duration. Always check where the animals were in their feeding cycle before reading a change as a substrate effect.
Pro tip: Log the time of the last meal and the fasting duration for every animal in the RER dataset. Without those columns, a fed-state difference between groups can look like a fat oxidation effect.
Study Design Controls for Paired Assays
A paired GCGR and calorimetry study has to rule out the obvious alternatives before the interesting result means anything. The core controls are a vehicle arm, a pair-fed arm and, where practical, a weight-matched arm. Each one removes a specific confound, and dropping any of them weakens the conclusion.
Pair-feeding separates intake from direct effects
A pair-fed control receives the same amount of food as the treated group on each day, which is usually less than the vehicle group eats. If the treated animals still show higher expenditure or a lower RER than the pair-fed controls, the effect is less easily explained by reduced intake alone. If the pair-fed arm looks the same as the treated arm, the metabolic signal may be a secondary consequence of eating less.
Pair-feeding is labour-intensive because the intake of the treated group must be known before the controls are fed. Plan for daily weighing of food, and decide in advance how you will handle days when the treated group eats very little.
Acclimation, light cycle and housing
Animals moved into metabolic cages need a settling period before recordings count. A common practical minimum is at least one full light-dark cycle, though some protocols use longer. Record the acclimation period in the methods, and exclude the settling data from analysis rather than hoping the first day washes out.
Keep the light cycle, room temperature and cage density identical across arms. Temperature alone can shift expenditure enough to swamp a modest compound effect, so log it continuously and report the range.
Normalizing Energy Expenditure Data
Raw energy expenditure values are dominated by body size. A heavier animal burns more energy in absolute terms, which means that a group difference in body mass can masquerade as a difference in metabolic rate. The normalization method you choose can change the conclusion, so it has to be fixed before the data are analysed.
Lean mass covariates versus allometric scaling
Two approaches dominate. An analysis of covariance (ANCOVA) with lean mass as the covariate lets the data show how expenditure relates to lean tissue within each group. Allometric scaling divides expenditure by body mass raised to a fitted exponent, which requires you to estimate that exponent from your own data rather than assume a value.
A 2025 analysis of energy expenditure across economic groups found that body size-adjusted total energy expenditure was only weakly associated with measures of obesity. That result is a useful warning: once you adjust properly, expect modest effect sizes, and power your study accordingly rather than designing around a large expected shift.

Activity and time-of-day windows
Expenditure is not constant across the day, and activity contributes heavily to the total. Split the data into defined windows, such as light and dark phases, and analyse activity-adjusted expenditure separately. Decide in advance whether activity is a covariate, a stratifying variable or a secondary endpoint, and do not switch the choice after seeing the results.
Exclude sessions with equipment faults or large, unexplained gaps in gas readings, and report how many sessions were excluded per group. Silent exclusions are one of the quickest ways to make a paired dataset impossible to reproduce.
Common Mistakes in Paired Studies
Most errors in energy expenditure obesity models are not exotic. They come from skipping a control, choosing a normalization after the fact, or reporting a window that happened to work. Recognizing these patterns early saves weeks of rework and makes the final data far more persuasive to reviewers.
Reading total kcal/h without body composition
A group that is heavier with more lean mass will often show higher total kcal/h, and a group with more fat mass may show a lower value per gram. If you do not measure or record body composition, you cannot separate those effects from the compound effect. Record fat and lean mass at baseline and at the end of the study, even when the primary endpoint is expenditure.
Reporting one time window and calling it the effect
Calorimetry produces a continuous trace, and it is easy to find a window where the difference looks large. Choose the analysis window before the study, justify it biologically, and show the full trace as a supplementary figure so readers can see whether the effect is sustained or transient.
Pro tip: Pre-register your primary endpoint, analysis window and normalization method in a written protocol before the first animal enters a chamber. Changing any of them after seeing the data is the single most common reason paired results fail to replicate.
Sourcing and Documenting Research Compounds
The compound is a variable like any other in the study, and undocumented variation in purity or handling can produce results that no amount of statistics will fix. Pepura Labs supplies retatrutide as lyophilized research compounds in 10 mg, 20 mg, 40 mg, 60 mg and 84 mg options, independently verified by Canadian laboratories with full Chain of Custody documentation. All products are for in vitro research use only and are not intended for human consumption.
What a usable certificate of analysis should show
A certificate of analysis is only useful if it matches the vial in your freezer. Check that the lot number on the certificate matches the vial label, that the purity is stated for that lot, and that the testing laboratory and method are identified. Batch traceability is what lets you connect a result from two years ago to the exact material that produced it.
When a study spans several purchases, record the lot for every vial used in every arm. Mixing lots across treatment groups without recording them introduces a confound that calorimetry cannot detect.
Reconstitution and storage records
Lyophilized material is usually reconstituted with bacteriostatic water before use, and the reconstitution date, diluent lot and storage temperature should be logged. Follow your laboratory's standard operating procedure for handling, and aliquot where possible to avoid repeated freeze-thaw cycles. A clean record of these steps is what allows another group to repeat your preparation exactly.
Pro tip: Keep a single batch log that links each vial lot, reconstitution date, aliquot ID and assay run. When a result looks unexpected, that log tells you within minutes whether the material or the method is the more likely cause.
Frequently Asked Questions
What is an energy expenditure obesity model used for in GCGR research?
It is used to measure how much energy an animal burns, alongside what it eats and how it uses fuel, after glucagon receptor activation. The aim is to separate an effect on expenditure from an effect on appetite, which weight data alone cannot do.
Why pair GCGR agonism with indirect calorimetry instead of measuring weight alone?
Weight change reflects intake and expenditure together. Indirect calorimetry measures oxygen use and carbon dioxide output, which lets you calculate expenditure and RER, and that is how you tell a metabolic effect from a feeding effect.
Does glucagon receptor activation always increase energy expenditure?
No, and any study that assumes it will is at risk. The literature points to shifts in fat oxidation and ketone production, and the effect on total expenditure varies across models, so the result should be measured rather than predicted.
How long should animals acclimate before calorimetry recordings start?
A common practical minimum is one full light-dark cycle in the chamber, and some protocols use longer. Record the acclimation period in your methods and exclude it from analysis, since early data often reflect handling and novelty.
Is retatrutide suitable for human use based on this research?
No. Pepura Labs supplies retatrutide strictly for in vitro research use, and nothing in a preclinical calorimetry study constitutes guidance for human dosing or consumption. Any translation to people requires independent clinical research under appropriate oversight.
Can an in vitro fat oxidation assay replace whole-animal calorimetry?
No. A cell-based fatty acid oxidation assay tests whether the receptor signal reaches the substrate machinery, while calorimetry tests whether the effect survives whole-organism physiology. They are complementary, and a strong study usually includes both.
If you have run paired GCGR and calorimetry studies, tell us which normalization approach held up best in your hands and what broke in your setup.
References
- Review of energy expenditure as an obesity therapy target, from preclinical models onward
- Glucagon effects on energy expenditure, fat oxidation and ketone production
- Variable glucagon metabolic actions across diverse mouse models of obesity and diabetes
- GLP-1 and glucagon receptor co-agonism and the balance of receptor potency
- Body size-adjusted energy expenditure and obesity measures across economic groups