
Peptide quantification HPLC is the method most careful labs trust when a concentration number has to hold up. Direct UV absorbance is faster and cheaper, and it gets used constantly for quick checks. The trouble is that both methods can return a clean-looking number that is wrong for different reasons. If a vial is labeled 10 mg and your bench reading lands at 8.6 mg, the gap might come from the peptide, the detector, the standard, or the way you weighed and diluted. This guide explains where each method fails with retatrutide samples and how to choose between them.
Table of Contents
- Quick Takeaways
- Why Quantification Matters for Retatrutide Research
- How UV Absorbance Works on Peptide Samples
- How HPLC Separates and Quantifies Peptides
- Choosing Between HPLC and Direct UV Absorbance
- Common Mistakes in Retatrutide Concentration Measurement
- Reporting Results and Matching Them to a COA
- Frequently Asked Questions
- References
Quick Takeaways
| Key Insight | Explanation |
|---|---|
| Direct UV absorbance is only as reliable as your absorptivity value and your sample purity. | Use it for rapid checks on clean, well-characterized solutions, not for records you will need to defend later. |
| HPLC with UV detection measures the target peak, not total absorbance. | Integrate the main peak area and confirm its identity by retention time and spectral shape before you calculate anything. |
| Peptides without Tyr, Trp, Phe or His give a weak signal at 280 nm. | Check the sequence, then move to a lower wavelength in the far UV and confirm your solvent is transparent there. |
| A single-point calibration hides nonlinearity. | Build a curve with at least five reference concentrations, inject each in replicate, and inspect the residuals. |
| Gradient shape controls peak resolution for peptides. | Start at low organic content and use a shallow slope of about 1 percent B per minute, as common peptide practice suggests. |
| A gap between your number and the COA larger than your method precision is a signal to investigate. | Check balance calibration, diluent volume, and vial rinsing before you question the material itself. |
Why Quantification Matters for Retatrutide Research
Retatrutide is a research peptide that acts on GIP, GLP-1 and glucagon receptors, which makes it a frequent subject in metabolic signaling work. Nearly every experiment built on it assumes you know how much peptide is in the well. If your concentration is off by a modest margin, every downstream potency value inherits that error, and no reviewer will care whether the mistake started in the vial or at the bench.
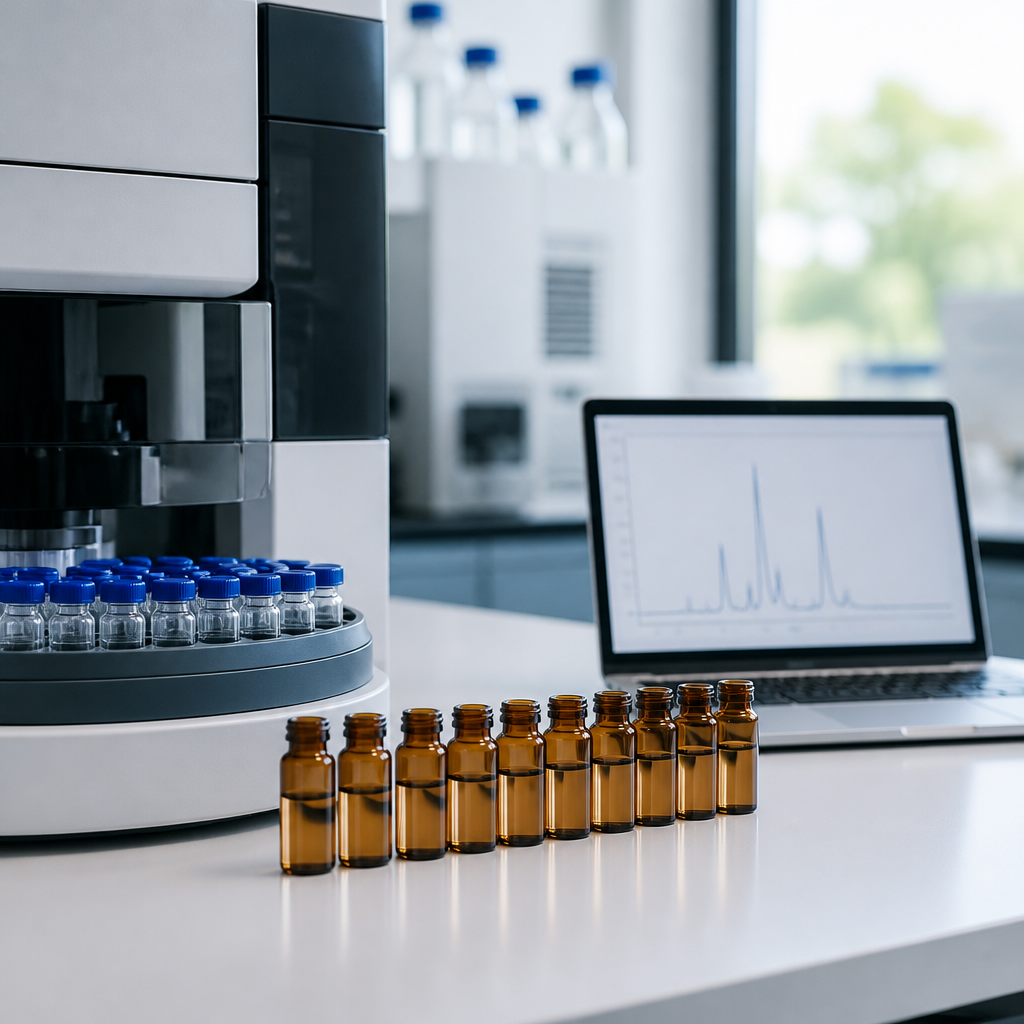
Lyophilized peptides make the problem harder. The number on a label may reflect gross fill weight rather than net peptide content, because the powder also carries water, counterions such as trifluoroacetate, and residual salts. An HPLC purity figure tells you what fraction of the chromatographic signal belongs to the main peak. It does not, by itself, tell you how many milligrams of peptide you actually dissolved.
In our workflow we treat identity, purity and content as three separate questions. Identity confirms the molecular mass, purity describes how clean the material is, and content describes how much usable peptide sits in your solution after reconstitution. Our COA documentation and Chain of Custody records answer the first two in writing. Your own quantification is the only thing that answers the third for your specific preparation.
A purity figure describes the sample that was analyzed. A concentration figure describes the solution you are about to use. Only the second one is what your experiment depends on.
How UV Absorbance Works on Peptide Samples
Direct UV absorbance applies the Beer-Lambert relationship: absorbance rises with concentration, path length and the molar absorptivity of the species in solution. In principle that makes it the simplest quantification route, since you need a cuvette, a spectrophotometer and a known absorptivity. In practice, the absorptivity of a peptide is the weakest link in the chain.
Where peptide bonds and aromatic residues absorb
The peptide backbone absorbs strongly in the far UV, roughly in the 205 to 220 nm window, because of the amide bonds that link every residue. Aromatic side chains such as tryptophan, tyrosine and phenylalanine absorb much further toward 280 nm. Many protein assays lean on that 280 nm signal, which works well when the sequence carries plenty of aromatic residues. A peptide with few or none of them gives a weak signal at 280 nm, and this comes up often in method forums, where researchers ask whether peptides lacking Tyr, Trp, Phe or His can be measured by UV HPLC at all. The short answer is that you can, but you have to move to lower wavelengths and confirm that your solvent is transparent there.
Before you pick a wavelength, check the sequence and count the chromophores. Then run a blank and a dilute standard at two or three wavelengths and choose the one that gives a linear, low-noise response. Standard polystyrene cuvettes absorb heavily below about 300 nm, so use quartz for any far UV work. Plastic that looks fine at 280 nm can quietly bias a reading at shorter wavelengths.
Extinction coefficients for peptides are often estimated from sequence-based calculations rather than measured. Those estimates are reasonable for proteins with known aromatic content, but they become unreliable for short sequences with few chromophores. If you use a calculated value, say so in your report and label the result as an estimate.
Why the sample matrix distorts direct readings
Direct UV reads everything in the light path, not just your peptide. Trifluoroacetic acid, which is common in peptide chromatography and often carried over from synthesis and purification, absorbs at low wavelengths. Buffers, DMSO, and the benzyl alcohol preservative found in bacteriostatic water all contribute as well. Bacteriostatic water is a common reconstitution diluent, so the blank has to match it exactly, including the preservative, or the baseline will be wrong before you start.
Light scattering is the other problem. Aggregates and particulates in a reconstituted solution raise the baseline without adding peptide, which inflates the apparent concentration. Spin the sample, filter it if your peptide allows, and inspect the spectrum for a sloping baseline before you trust a single absorbance value. A flat, reproducible background is a good sign. A baseline that climbs toward the short wavelengths is a warning.
Pro tip: Make your blank from the same bottle of diluent you used to reconstitute the peptide, not from a fresh bottle. Small differences in lot or preservative content are enough to shift a low-wavelength reading.
How HPLC Separates and Quantifies Peptides
HPLC changes the question. Instead of asking how much light the whole solution absorbs, it asks how much signal the target peptide produces after it has been separated from everything else. Reversed-phase separation on a C18 column is the usual starting point. A 2007 review of HPLC modes for peptides covers the main approaches, and the common thread is that truncated sequences, deletion products, oxidized forms and salts elute at different times from the intact peptide. The peak you integrate therefore belongs to your peptide rather than to the whole mixture.
Gradient design for peptide separation
Peptides need different method conditions from small molecules. A Phenomenex technical note on peptide analysis recommends starting at a low percentage of organic solvent to focus peptides at the front of the column, then running a shallow slope up to roughly 50 to 60 percent organic, where most peptides should elute. A slope of about 1 percent B per minute is described as typical. Acetonitrile is the usual eluting solvent for peptides.
The same note identifies pH as the most dramatic lever for selectivity, with a small pH change capable of a large shift in retention. Buffer choice matters too. TFA, formic acid, HFBA and phosphate buffers all appear in peptide methods, and each one changes peak shape and detection behavior. A common mistake is changing the buffer to improve mass spectrometry compatibility and assuming the old integration window still applies. Re-check retention and peak shape after any buffer change.
Pro tip: The same Phenomenex note lists column temperature in the range of 40 to 90 degrees C as a tunable variable. Hold it constant across every standard and sample in a sequence, or your retention times will drift and your integration will follow.
Calibration with a reference standard
HPLC quantification is only as good as its calibration. Prepare a reference standard of known content at no fewer than five concentrations spanning the range you expect in your samples, inject each level in replicate, and fit a linear regression. Check the residuals, not just the correlation coefficient. A curve can look linear with an r value near one and still miss badly at the low end.
Use the same integration parameters for standards and unknowns, and keep them fixed for the whole run. A single-point calibration is the most common shortcut, and it is the one that makes results hardest to defend. If that one standard is off, you have no way to tell.
Choosing Between HPLC and Direct UV Absorbance
The choice comes down to what the number will be used for. Direct UV is appropriate for a quick check on a clean, well-characterized solution where you already know the absorptivity and no other UV-absorbing material is present. HPLC is the right choice when you need to separate the peptide from impurities, quantify against a traceable standard, or defend the number to someone who will ask how it was measured.
A 2011 study indexed in PubMed compared fluorescence, laser-induced fluorescence and ultraviolet absorbance detection for measuring HPLC-fractionated peptides and proteins, which is a reminder that the detector is itself a variable. A 2019 survey of peptide quantification methods examined inter-laboratory variability across approaches including HPLC assay and quantitative NMR. The lesson from both is that a number is only comparable to another number when the method and the reference are documented.
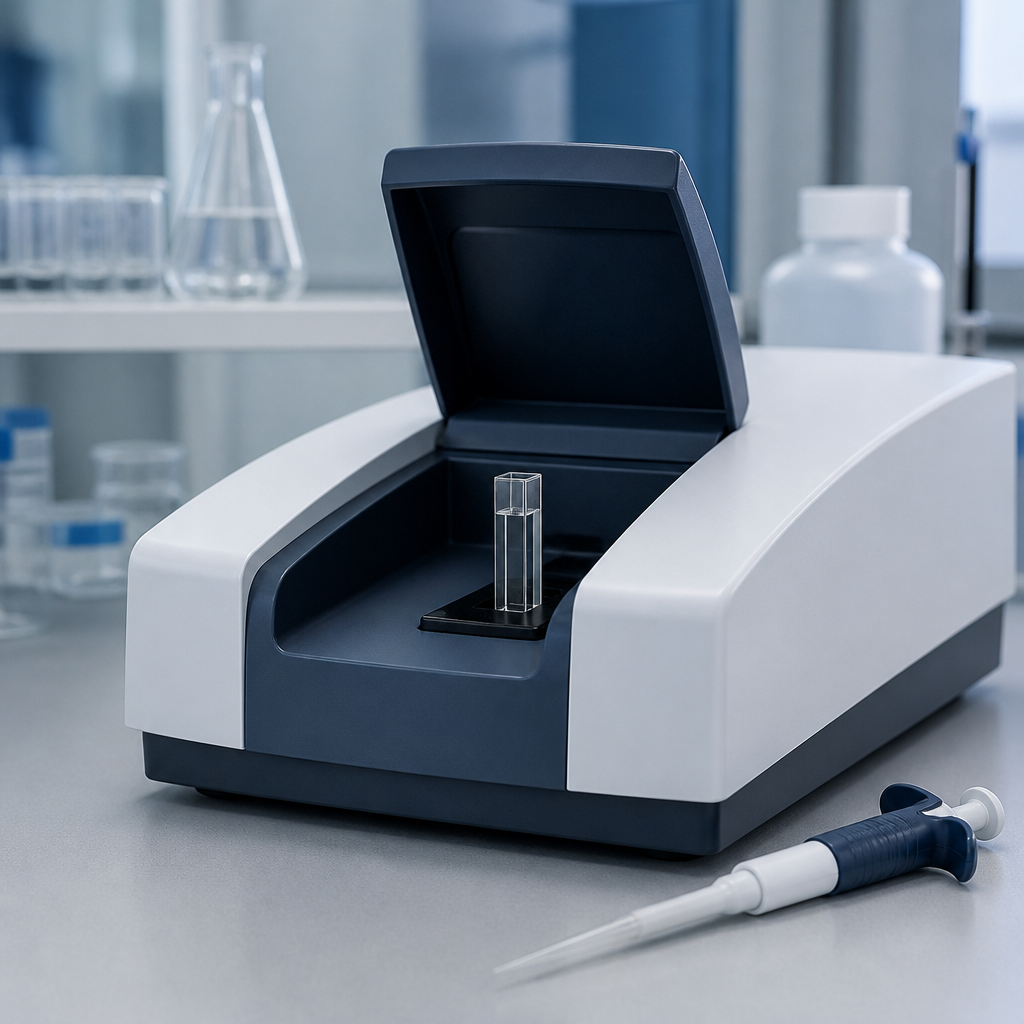
Head-to-head comparison
| Criterion | HPLC with UV Detection | Direct UV Absorbance |
|---|---|---|
| Specificity | Separates the target peptide from impurities and degradation products before detection | Measures total absorbance of everything in the light path |
| Calibration | Multi-point curve against a reference standard | Depends on an absorptivity value that may be estimated |
| Vulnerability to matrix interference | Reduced, because most matrix components elute apart from the peak | High, because buffers, preservatives and particulates all contribute |
| Time per sample | Longer, with run time and column equilibration | Minutes |
| Best use | Stability studies and concentration reports you need to defend | Rapid screening of clean, well-characterized solutions |
Our rule of thumb is simple. Use direct UV to decide whether a sample is roughly where it should be, and use HPLC to decide what number goes into your records. If the two disagree by more than your method's precision, trust the HPLC result until you have found the reason for the gap.
Common Mistakes in Retatrutide Concentration Measurement
Reconstitution and dilution errors
Most concentration errors happen before the instrument is switched on. Lyophilized peptide sticks to the walls of tubes and pipette tips, especially at low concentrations, so use low-binding plastics and rinse tips when you transfer. Vigorous vortexing can cause foaming and surface-driven loss, so a gentle swirl or slow rock is usually the better choice. Record the diluent volume and the balance used, because a small pipetting error compounds through every serial dilution.
Serial dilution deserves its own warning. Each step multiplies the error from the step before, so a standard prepared by three dilutions in a row can carry far more uncertainty than a single careful dilution from a weighed stock. Document each step in the same notebook entry, so the next person can trace it.
Pro tip: Run a freshly prepared mid-range standard as an unknown in every sequence. If it recovers within your acceptance limit, you have a quick check that the calibration still holds.
Trusting a single injection or a single wavelength
One injection tells you almost nothing about precision. Inject replicates of each standard and each sample, and report the spread alongside the mean. If replicates scatter widely, the problem is usually the injection, the column equilibration, or a dirty flow path rather than the peptide itself.
A single wavelength is a similar trap. Confirm peak purity with a diode array detector if you have one, or at least compare retention and spectral shape against the reference. A shoulder or co-eluting peak can inflate the integrated area while the main peak still looks clean at a glance, and that inflated area pushes your concentration high.
Reporting Results and Matching Them to a COA
A concentration number is only useful if someone else can reconstruct it. A defensible report states the method, the detection wavelength, the column and mobile phase, the reference standard and its lot, the calibration range and fit, the replicate count, and the lot number of the peptide under test. Missing any of those makes the number hard to compare across runs or across laboratories.
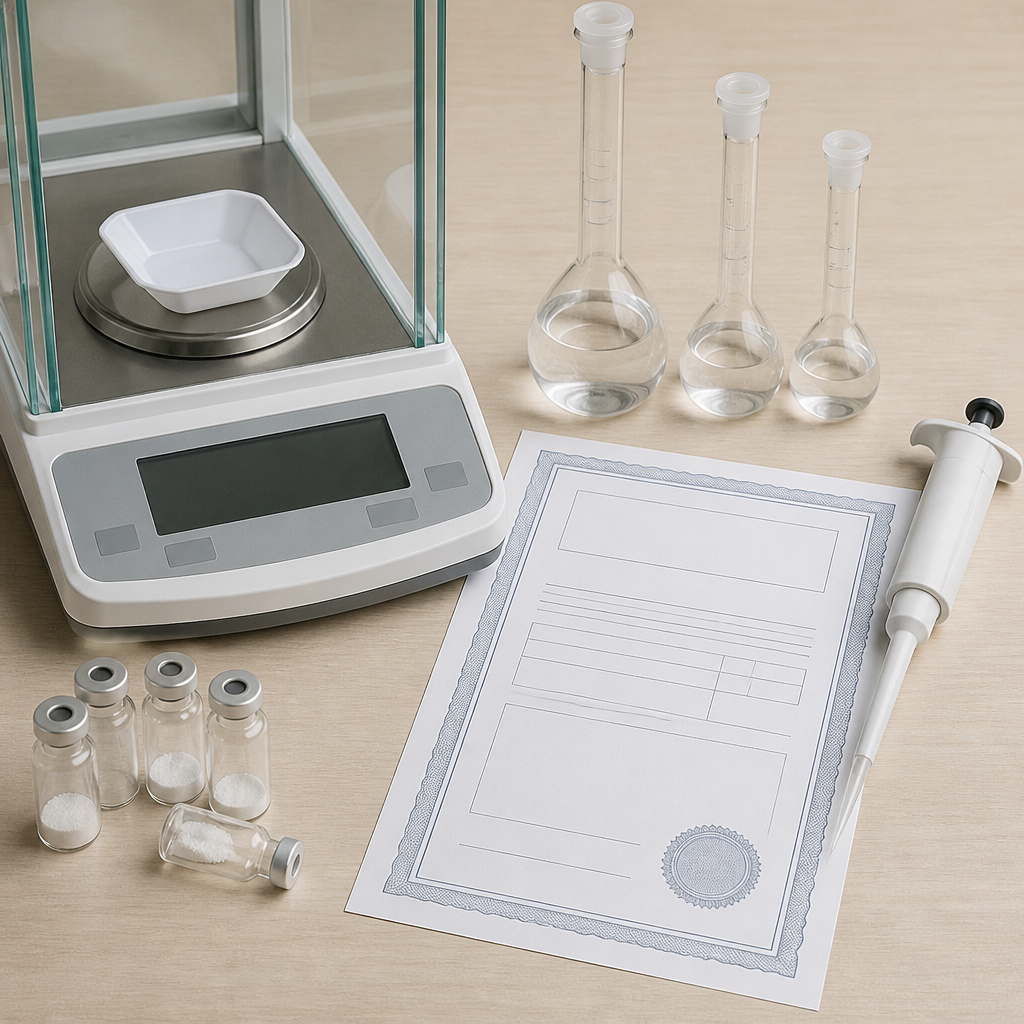
What a COA and your measurement should agree on
A certificate of analysis documents identity, purity and, where tested, content for a specific batch. Our lyophilized compounds are independently verified by Canadian laboratories, and each batch carries Chain of Custody documentation that links the sample to its testing record. Your measurement is a separate result on a separate aliquot. The two should agree within the uncertainty of your method, but they are not the same number, and a COA does not replace your own reconstitution calculation.
When your number disagrees with the certificate
When your result falls outside the expected range, work through the likely causes in order. Start with the easy ones: balance calibration, diluent volume, and whether the vial was fully rinsed. Then check the standard, the integration, and the wavelength. Only after those should you suspect the material itself. Document each check so the next person does not repeat it.
For research use, keep reconstituted solutions under the storage conditions your protocol specifies, and re-quantify any solution from a vial that has been opened repeatedly or held at room temperature for long periods. Our compounds are sold strictly for in vitro research, and every quantification decision belongs in your own lab records.
Frequently Asked Questions
Is HPLC always more accurate than UV absorbance for retatrutide?
Not automatically. HPLC is more specific because it separates the peptide from impurities and matrix, but accuracy still depends on the reference standard, the calibration design and the integration settings. A poorly calibrated HPLC result can be less trustworthy than a careful UV reading on a clean solution.
Which wavelength should I use for UV absorbance on a peptide with no aromatic residues?
Plan on the far UV, where the peptide bond absorbs, and confirm that your buffer and diluent are transparent at that wavelength. Use quartz cuvettes and a matched blank. Expect lower sensitivity than you would get at 280 nm for an aromatic-rich sequence.
Can I use the HPLC purity percentage as the concentration of my solution?
No. Purity is the fraction of the chromatographic signal coming from the main peak. Concentration requires a calibration against a reference standard, and it must account for the net peptide content of the lyophilized powder, not just its purity.
How many calibration points do I need?
At least five concentrations spanning the expected range, each injected in replicate, is a sensible minimum. Check the residuals and confirm that the low end is not being pulled off the line by the high end.
Why do my UV and HPLC numbers differ?
Usually because UV counts everything absorbing at the chosen wavelength, including buffers, preservatives and aggregates, while HPLC integrates only the target peak. A gap larger than your method precision is a prompt to investigate, not a reason to pick the more convenient number.
What should I include when I share a concentration result with a collaborator?
Include the method, detector settings, column, mobile phase, reference standard identity and lot, calibration range and fit, replicate count, and the lot number of the peptide. Attach the COA for reference and state clearly that the material is for in vitro research use only.
Which method has given you the number you trusted most when your UV and HPLC results disagreed, and what did you find when you tracked the gap down?
References
- Overview of HPLC approaches to peptide analysis and digestion workflows
- Phenomenex guidance on gradient and pH choices for peptide method development
- Survey of peptide quantification methods and inter-laboratory variability
- Comparison of fluorescence and UV absorbance detection for HPLC-fractionated peptides
- Review of HPLC modes and purification protocols for peptides