
A receptor binding affinity assay answers a question that functional data cannot: how tightly does a compound occupy its receptor? For retatrutide, an investigational peptide that engages GIP, GLP-1, and glucagon receptors, that question has to be asked three times, each with its own receptor preparation, tracer, and curve fit. Competitive displacement studies are the workhorse here because they measure an unlabeled compound's affinity without chemically modifying the molecule you care about. Get the design wrong and the Ki you report will look precise while meaning very little. This guide covers how we would set one up, where it usually breaks, and what documentation belongs in the file before the first plate is read.
Table of Contents
- Quick Takeaways
- What a Receptor Binding Affinity Assay Measures
- Why Retatrutide Needs a Three-Receptor Panel
- Designing the Competitive Displacement Study
- Preparing Retatrutide Stock Solutions
- Choosing a Readout Method
- From IC50 to Ki: Analyzing Displacement Curves
- Mistakes That Ruin Displacement Data
- Documentation and Quality Control Before the Plate
- Frequently Asked Questions
- References
Quick Takeaways
| Key Insight | Explanation |
|---|---|
| Measure the tracer's KD in your own system first | Your Ki value is only as reliable as the tracer KD behind it, so run saturation binding on your receptor prep before any displacement work. |
| Keep tracer concentration near its KD | A high tracer concentration compresses the assay window and pushes apparent IC50 values upward, which makes weak compounds look weaker than they are. |
| Run GIP, GLP-1, and glucagon receptor panels separately | Each receptor needs its own preparation, tracer, and controls, and a pooled number hides the selectivity profile the study was designed to reveal. |
| Verify concentration after reconstitution | The nominal concentration from a vial label is a starting estimate, so confirm it with an orthogonal method before building a dilution series. |
| Convert IC50 to Ki with the Cheng-Prusoff correction | Use the tracer concentration you actually loaded and the KD from your own system, and state the equation in your methods. |
| Define nonspecific binding with enough unlabeled ligand | A marginal excess of reference ligand underestimates specific binding and shifts the whole curve, so document the concentration used. |
What a Receptor Binding Affinity Assay Measures
A receptor binding affinity assay measures how strongly a ligand associates with its target at equilibrium. The standard descriptor is the equilibrium dissociation constant, KD, which is the ligand concentration at which half the binding sites on a biomolecule are occupied at equilibrium. A lower KD means tighter binding, all else being equal.
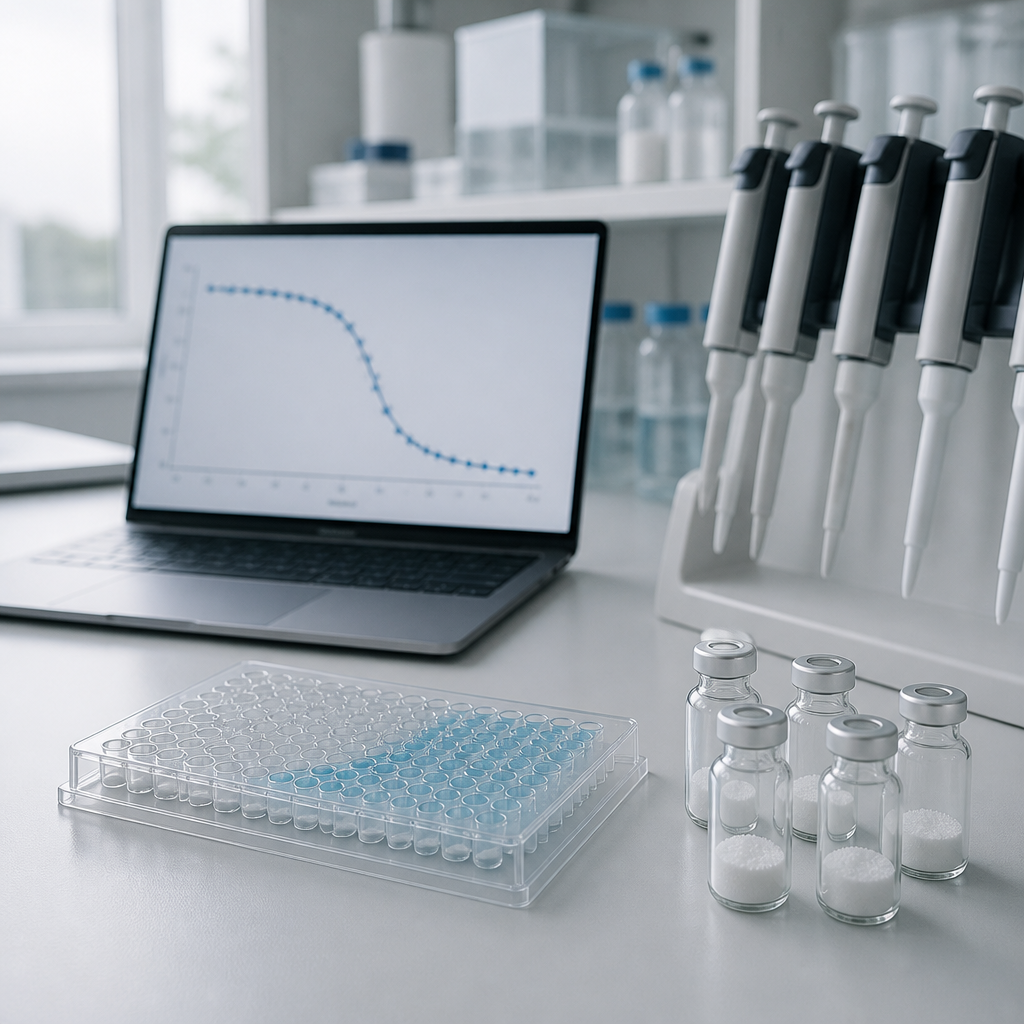
Competitive displacement sits one step removed from direct binding. Instead of labeling the compound you want to characterize, you hold a labeled reference ligand at a fixed concentration and add the unlabeled test compound across a dilution series. As the test compound occupies receptor sites, the labeled signal drops, and the shape of that drop gives you an IC50 for the test compound.
Why IC50 is not Ki
IC50 is the concentration of test compound that removes half of the specific labeled signal under your conditions. It depends on the tracer concentration and the tracer's own affinity, so it cannot be compared across labs or even across plates run on different days. Ki, the affinity of the unlabeled compound, is the number that travels between studies, and the Cheng-Prusoff correction covered later in this guide is how you get there.
What a usable displacement curve looks like
A clean curve has a top plateau near total binding, a clear transition, and a bottom plateau near nonspecific binding. Most failed studies are not failures of the math. They show a shallow top, a bottom that never flattens, or a slope far from unity, and each of those points to a specific setup problem rather than a weak compound.
A displacement curve is only as trustworthy as the wells that define its top and bottom, so spend your control budget there before you spend it on extra concentration points.
Why Retatrutide Needs a Three-Receptor Panel
Retatrutide acts on three targets: the GIP, GLP-1, and glucagon receptors. That makes it a poor candidate for a single-receptor binding readout. A result from one receptor tells you little about the other two, and selectivity across the panel is often the reason the study exists at all.
Each receptor needs its own membrane or cell preparation, its own validated tracer, and its own saturation and displacement controls. Using one tracer across all three panels is a shortcut that shows up later as Ki values you cannot reconcile. Keep the three arms separate from plate layout through data analysis.
Selecting a tracer for each receptor
The tracer should bind the receptor you are studying with a known KD in your system, not one taken from a paper that used a different preparation. Run saturation binding on your own prep first, and only then set the displacement tracer concentration. If your prep has low receptor density, expect a narrow assay window and plan for more replicates rather than raising tracer concentration to compensate.
Peptide adsorption across every panel
Peptides adsorb to polystyrene and polypropylene surfaces, and the loss becomes more serious at low nanomolar concentrations. A common mistake is preparing the dilution series in standard tubes and then wondering why the lower concentrations seem weaker than expected. Use low-binding plastics for intermediate dilutions and keep the time between dilution and plate loading short.
Designing the Competitive Displacement Study
Start with the question. Are you ranking compounds, or are you reporting an absolute affinity for a publication or an internal decision? Ranking tolerates more variability. Absolute Ki values demand tighter controls, a documented tracer KD, and enough concentration points to fit the curve without extrapolating beyond the data.

Use at least eight concentrations of unlabeled retatrutide spanning several log units, with the midpoint near the expected IC50. Run each concentration in duplicate or triplicate on the same plate, and randomize the layout so edge effects do not line up with the highest concentrations. Total binding wells, nonspecific binding wells, and a reference unlabeled standard should appear on every plate.
Setting the incubation time
Equilibrium has to be reached before you read the plate, and peptide kinetics do not always follow a tidy schedule. Run a time-course pilot in your system and choose an incubation that sits comfortably past the plateau. Reading too early produces an apparent IC50 that reflects kinetics rather than affinity.
Defining nonspecific binding
Nonspecific binding is measured with a large excess of unlabeled reference ligand, and that excess has to be high enough to saturate specific sites completely. A marginal excess underestimates specific binding and shifts the entire curve. Write the reference concentration into the protocol so the next person can reproduce it exactly.
Preparing Retatrutide Stock Solutions
Pepura Labs supplies lyophilized retatrutide in 10 mg, 20 mg, 40 mg, 60 mg, and 84 mg presentations, along with bacteriostatic water for reconstitution. Every vial is intended for in vitro research use only. The mass on the label is not the concentration in solution, so treat reconstitution as an experiment with its own records.
Reconstitution and concentration verification
Reconstitute with the stated volume of bacteriostatic water, let the peptide dissolve fully without vigorous shaking, and record the lot number, volume, and time. Lyophilized peptide can carry moisture and salt content that the label does not capture, so the nominal concentration is a starting point. Confirm the working concentration with an orthogonal method before you build the dilution series for a Ki study.
Pro tip: Record the bacteriostatic water lot and volume in your notebook. If your receptor prep or cell system is sensitive to benzyl alcohol, run a vehicle-only control at the same final concentration before you attribute any shift to the compound.
Storage, aliquoting, and freeze-thaw discipline
Aliquot reconstituted stock into single-use volumes, store them at the temperature listed on the accompanying documentation, and avoid repeated freeze-thaw cycles. Each cycle is another chance for adsorption, aggregation, or loss of activity that will not show up on the binding plate until the data already look wrong. Label every aliquot with lot, concentration, date, and thaw count.
Choosing a Readout Method
The readout determines which kind of noise you will fight. Radioligand filtration remains a common choice for classical receptor work, while fluorescence-based and label-free methods trade some sensitivity or throughput for convenience and kinetic information. The BMG Labtech overview of binding assays notes that many formats can be categorized by detection technology and suit microplate readers, which makes it a practical starting filter.
Malvern Panalytical's binding affinity overview lists methods such as ELISA, surface plasmon resonance, and biolayer interferometry. Those are more often used for direct binding or kinetic characterization than for classical competitive displacement. Each has a different sample requirement and failure mode, so choose the readout by asking which artifact your study can tolerate.
Comparing displacement readouts side by side
| Readout | Where It Works Well | Main Limitation |
|---|---|---|
| Radioligand filtration | Classical receptor panels with a validated radiolabeled tracer | Handling and disposal requirements, plus wash-step variability |
| Fluorescence polarization | Peptide displacement with a fluorescent tracer, as described in published FP-based displacement work | Labeling can alter binding, and fluorescent compounds can interfere with the signal |
| Surface plasmon resonance | Direct binding and kinetic data with label-free detection | Immobilization can change receptor behavior, and competitive formats take more setup |
A common pattern is to start with fluorescence polarization because it fits a standard plate workflow, then move to a radioligand format when a fluorescent tracer measurably changes the binding behavior. Switching readouts mid-project is acceptable if you run a bridging experiment with a reference compound. Without that bridge, the two datasets cannot be compared.
From IC50 to Ki: Analyzing Displacement Curves
Fit displacement data with a four-parameter logistic model, constrain the top and bottom only where your controls justify it, and report the Hill slope with its confidence interval. A Hill slope far from one is a reason to examine the assay, not a number to explain away. Ki is calculated from IC50 with the Cheng-Prusoff equation, Ki = IC50 / (1 + [L]/KD), where [L] is the tracer concentration and KD is the tracer's dissociation constant in your system.
Applying the Cheng-Prusoff correction
The correction assumes a single-site competitive interaction at equilibrium and negligible tracer depletion. Plug in the tracer concentration you actually loaded, not the nominal value from the stock. Report the equation, the KD value, and where that KD came from, or nobody reviewing the work can check the Ki.
Hill slope and curve quality
A Hill slope near one suggests simple competitive behavior at a single site. Slopes well below or above one can reflect multiple binding sites, negative cooperativity, aggregation, or assay artifacts. In a three-receptor retatrutide panel, each of those possibilities has to be checked per receptor. Do not average across panels, and do not drop an outlier run without a documented reason.
Mistakes That Ruin Displacement Data
Most displacement data that fails review fails for reasons visible in the plate layout. The most common is a tracer concentration set too high, which pushes the assay into a regime where IC50 no longer reflects affinity. The second is ligand depletion, where so much receptor is occupied that free concentrations differ from what you calculated.
Ligand depletion and receptor concentration
Ligand depletion becomes a problem when receptor concentration is high relative to the KD of the ligands. The free concentration of test compound then falls below the amount you added, which biases the apparent IC50 upward. Keep receptor concentration low enough that bound ligand stays a small fraction of the total.

Solvent, carrier, and plate effects
Hold solvent concentration constant across the entire dilution series, including the wells with no test compound. If your protocol uses a carrier protein to reduce adsorption, validate it, because carrier proteins can bind the test compound and change the free fraction. Document whichever choice you make.
Pro tip: Run the reference unlabeled standard on every plate, not just the first. Drift in its IC50 across plates is the earliest warning that your receptor prep or tracer has changed.
Documentation and Quality Control Before the Plate
Before any plate goes into the incubator, the file should contain the lot number, the certificate of analysis, the reconstitution record, the storage history, and the tracer KD from your own saturation work. Pepura Labs provides Canadian laboratory testing and COA documentation for its retatrutide lots, with batch traceability, so the link between the vial and the Ki you report can be followed. Without that chain, a surprising result has no clear path to diagnosis.
What a COA should tell you before you run a study
Check the stated purity, the analytical method, the lot identity, and the testing date. A purity figure without a method is incomplete, because the method determines what the number actually measures. Compare the COA against the lot you have in hand before reconstitution, not after the data disappoint you.
Linking lab records to reported results
When you report Ki values, state the lot, the reconstitution concentration, the verification method, and the source of the tracer KD. Collaborators can then judge whether differences between studies reflect biology or handling. For lot-level documentation and research-grade retatrutide options, see Pepura Labs.
Frequently Asked Questions
What is the difference between IC50 and Ki in a competitive displacement study?
IC50 is the concentration of test compound that reduces specific tracer binding by half under your exact conditions. Ki is an estimate of the test compound's intrinsic affinity, calculated from IC50 with the Cheng-Prusoff equation using the tracer concentration and tracer KD.
Why do retatrutide studies need separate GIP, GLP-1, and glucagon receptor panels?
Retatrutide engages three distinct receptors, so a pooled value hides which receptor drives the signal. Each panel needs its own tracer, receptor preparation, and controls to produce interpretable affinity and selectivity data.
How close should the tracer concentration be to its KD?
Staying near the KD usually gives a workable assay window while keeping the Cheng-Prusoff correction reliable. Going well above the KD compresses the window and biases apparent IC50 values upward.
Can I use bacteriostatic water for reconstitution in every receptor assay?
Bacteriostatic water is the diluent we supply for reconstitution. If your receptor preparation or cell system is sensitive to its preservative, run a vehicle-only control at the same final concentration and document the result before drawing conclusions.
Does a certificate of analysis confirm the concentration in my assay?
No. A COA confirms identity, purity, and testing details for a lot, but the working concentration in your solution still needs verification after reconstitution. Treat the COA as the starting point for your records, not the final measurement.
If you have run a competitive displacement study on a multi-receptor peptide, tell us which readout and curve-fitting approach gave you the most reliable Ki values.