
When researchers begin designing a retatrutide concentration experiment, the first question is almost never about the biology. It is about numbers: how much compound to apply, at what intervals, and what signal to expect at each step. The answer is not arbitrary. Retatrutide dose-response behavior in cell-based systems follows a well-characterized pharmacological pattern rooted in its triple receptor mechanism, and understanding those patterns before you touch your reconstituted vial saves significant time and compound. This article breaks down what in vitro peptide research on retatrutide actually shows, receptor by receptor and concentration by concentration, so you can design experiments that produce interpretable data rather than noise.
Table of Contents
- Quick Takeaways
- The Triple Receptor Mechanism and Why It Complicates Dose Selection
- EC50 and Ki Values: What the Cell-Based Data Show
- cAMP Signaling as a Function of Concentration
- Assay Design Considerations for Retatrutide Concentration Research
- Comparison: In Vitro Assay Formats for Retatrutide
- Why Compound Quality Defines Your Dose-Response Curve
- Frequently Asked Questions
- References
Quick Takeaways
| Key Insight | Explanation |
|---|---|
| GIPR is the highest-affinity target in human cell systems | Retatrutide achieves an EC50 of approximately 0.064 nM at the human GIP receptor, making it by far the most potently activated of the three targets in cAMP assays. |
| GLP-1R and GCGR require higher concentrations to reach half-maximal activation | Human GLP-1R EC50 is around 0.775 nM and human GCGR EC50 is approximately 5.79 nM, meaning the three receptors engage sequentially as concentration increases. |
| Mouse and human receptor pharmacology differ meaningfully | Mouse GCGR Ki is roughly 73 nM versus 5.6 nM for human GCGR. Assuming rodent cell data will map cleanly to human receptor assays is a common experimental error. |
| cAMP accumulation is the primary in vitro readout | All three receptor pathways couple to adenylyl cyclase. Measuring intracellular cAMP across a concentration series (typically 0.01 to 100 nM) captures the full dose-response window. |
| Concentration-dependent effects extend beyond receptor binding | Published data on human atrial tissue show retatrutide elevates contractile force starting at 10 nM, rising through 100 nM, demonstrating tissue-level concentration dependence beyond simple receptor binding curves. |
| Peptide purity directly shapes the lower end of the dose-response curve | At sub-nanomolar concentrations, impurities or degradation products in a sample can compete with or mask receptor activation, distorting EC50 estimates and flattening the curve's lower inflection point. |
| Lyophilized retatrutide requires careful reconstitution to preserve dose-response integrity | Aggregation from vortexing or improper diluent selection introduces concentration error at the point of preparation, before the compound ever contacts a cell. |
The Triple Receptor Mechanism and Why It Complicates Dose Selection
Retatrutide (also referenced by its development code LY3437943) is a synthetic 39-amino-acid peptide engineered to simultaneously activate three G-protein-coupled receptors: the glucagon-like peptide-1 receptor (GLP-1R), the glucose-dependent insulinotropic polypeptide receptor (GIPR), and the glucagon receptor (GCGR). That simultaneous engagement is the pharmacological premise that makes it scientifically interesting. It is also exactly what makes in vitro dose-response design non-trivial.
A single-agonist peptide produces one sigmoidal curve. Retatrutide produces, in effect, three overlapping sigmoidal responses across three separate receptor populations, each with its own affinity and efficacy parameters. If your assay reads out a downstream signal common to all three pathways (cAMP is the most common choice), you are measuring the sum of those activations. Interpreting the resulting curve without knowing which receptor is dominating at which concentration is an interpretive trap.
The practical implication: concentration ranges that look like a plateau may actually reflect saturation of one receptor while another is still in its linear response range. Designing an experiment with only a three-point concentration series will almost certainly miss the GCGR inflection point, which sits nearly two orders of magnitude above the GIPR inflection.
Pro tip: When designing your first retatrutide dose-response curve in an overexpressing cell line, run at least eight concentration points spanning 0.001 nM to 100 nM. This range captures the GIPR inflection near 0.06 nM, the GLP-1R inflection near 0.8 nM, and the GCGR inflection near 6 nM without compressing any of them into ambiguity.

EC50 and Ki Values: What the Cell-Based Data Show
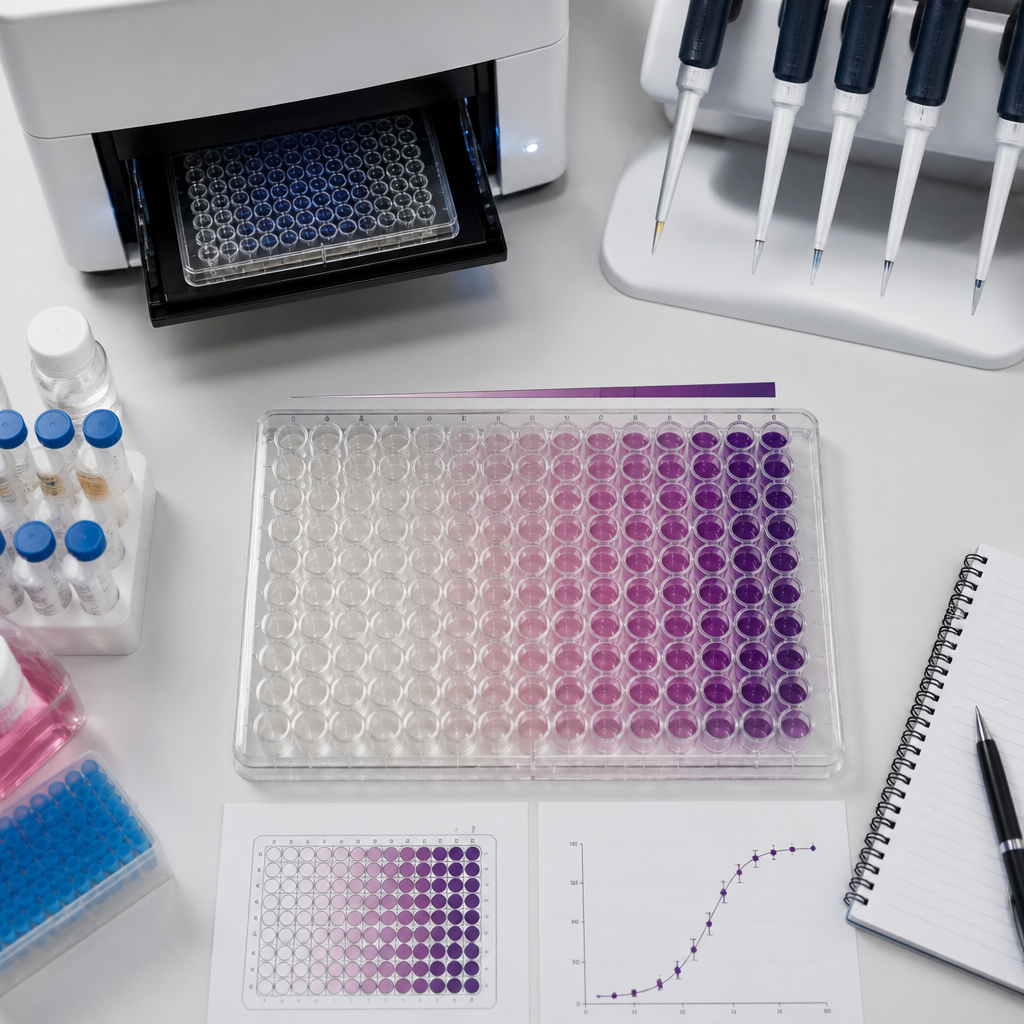
The most cited functional data on retatrutide receptor pharmacology come from cAMP accumulation assays conducted in HEK293 cells overexpressing the individual human receptors. These assays establish the half-maximal effective concentration (EC50) for each target under standardized conditions and provide the clearest benchmark for designing in vitro peptide research protocols.
Human Receptor EC50 Values
In HEK293 cells expressing the human receptors, retatrutide produces cAMP responses with EC50 values of approximately 0.0643 nM at the GIP receptor, 0.775 nM at GLP-1R, and 5.79 nM at GCGR. The binding affinity data (Ki values) follow a parallel pattern: approximately 0.057 nM at GIPR, 7.2 nM at GLP-1R, and 5.6 nM at GCGR. These figures place retatrutide in the sub-nanomolar to low-nanomolar range across all three targets, which is an unusually broad high-affinity profile for a single peptide.
Mouse Receptor Values and the Cross-Species Caution
The picture changes when you move to mouse receptor systems. Mouse GCGR EC50 is approximately 2.32 nM, a meaningful shift from the human 5.79 nM. More dramatically, mouse GCGR Ki is reported at approximately 73 nM compared to 5.6 nM for the human receptor. This is not a minor calibration difference. It reflects real structural divergence between species orthologs and has direct consequences for researchers using murine cell lines to predict human receptor pharmacology.
Mouse GLP-1R Ki is approximately 1.3 nM and mouse GIPR Ki approximately 2.8 nM, again diverging from human values. The take-home here is not that mouse data is useless. It is that cross-species extrapolation for retatrutide requires explicit acknowledgment of which receptor ortholog your data reflects.
A sub-nanomolar affinity at the GIP receptor does not predict sub-nanomolar behavior at GCGR. Treating retatrutide as a single-potency compound in experimental design is the most common conceptual error in this space.
cAMP Signaling as a Function of Concentration
All three receptors activated by retatrutide are coupled to Gs proteins and signal primarily through adenylyl cyclase activation, leading to intracellular cAMP accumulation. This shared downstream pathway is both an asset and a limitation for in vitro research: it provides a universal, well-validated readout, but it collapses three distinct receptor contributions into one number.
What the Atrial Tissue Data Add
Beyond overexpressing cell lines, published research in human right atrial tissue preparations offers a physiologically grounded perspective on concentration dependence. In those experiments, cumulatively applied retatrutide beginning at 10 nM and extending to 100 nM elevated contractile force in a concentration-dependent and time-dependent manner. When a phosphodiesterase III inhibitor was added to the preparation, retatrutide became both more potent and more effective, consistent with its mechanism of raising cAMP levels that are then degraded by phosphodiesterases.
This is relevant to in vitro research design in a specific way: the 10 to 100 nM window is not a range where simple receptor saturation explains all the biology. Downstream signal amplification and enzymatic degradation of the second messenger both modulate the observed response. Experiments that stop at 10 nM may miss the concentration-dependent effects that only emerge at higher exposures, particularly in primary tissue preparations rather than clean receptor-overexpressing systems.
IBMX and Phosphodiesterase Inhibition in Assay Conditions
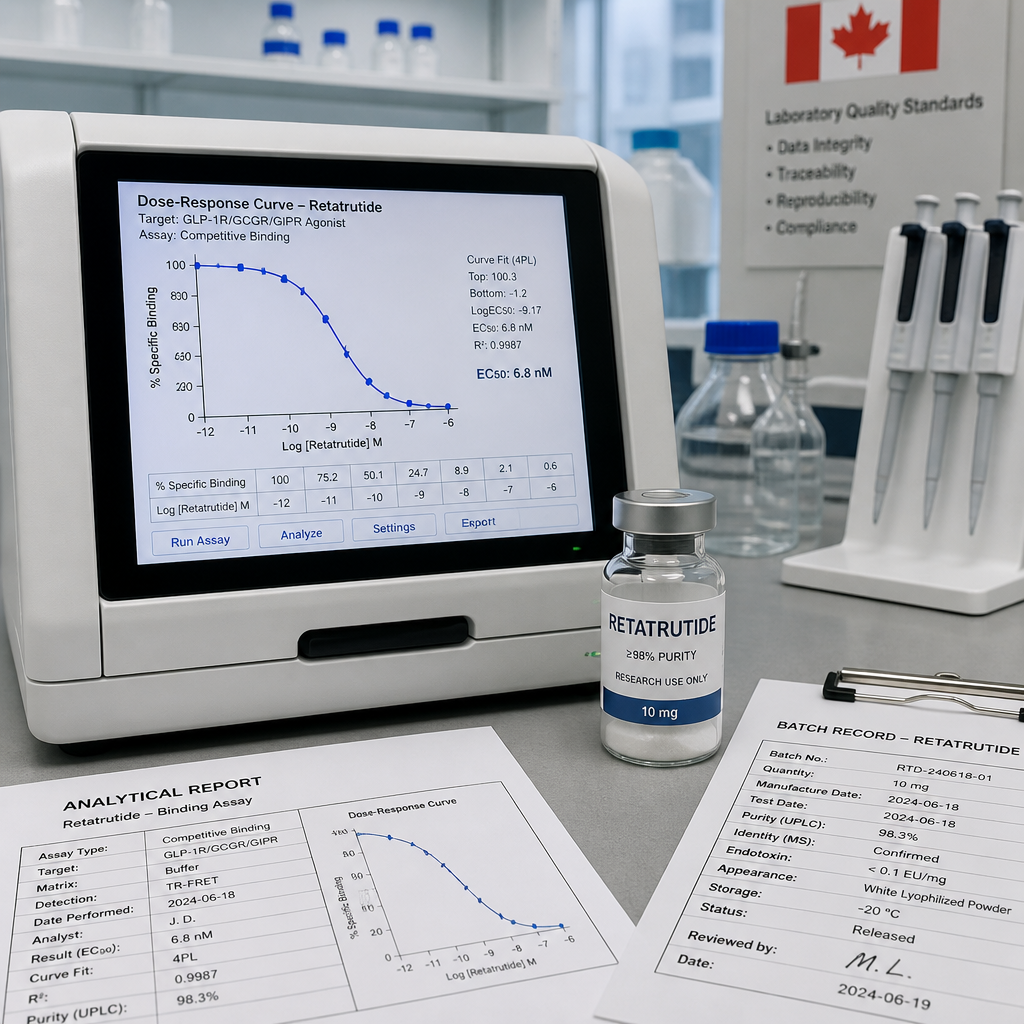
Standard cAMP assay protocols for retatrutide receptor pharmacology include IBMX (isobutylmethylxanthine) at concentrations around 250 µM to block phosphodiesterase activity and allow cAMP to accumulate detectably. This is not optional for sub-nanomolar concentration experiments. Without IBMX or equivalent phosphodiesterase inhibition, cAMP degradation competes with production at low agonist concentrations, and your measured EC50 will be an artifact of phosphodiesterase activity rather than a true reflection of receptor binding.
Pro tip: If you are comparing retatrutide concentration-response curves across different cell lines or assay batches, verify that your IBMX concentration and incubation conditions are identical across runs. Even a modest reduction in phosphodiesterase inhibition raises the apparent EC50 and can make a potent compound appear significantly weaker than a prior experiment suggested.
Assay Design Considerations for Retatrutide Concentration Research
Designing a retatrutide in vitro concentration study that produces reproducible, publication-quality dose-response curves requires attention to several variables that are specific to this compound rather than generic to all peptides.
Cell Line Selection
HEK293 cells stably overexpressing individual receptors are the established format for isolating receptor-specific pharmacology. Reporter gene systems using CREB-inducible reporter constructs (such as SEAP-based reporters driven by a cAMP-responsive element) allow colorimetric readout without the need for HTRF or TR-FRET equipment, though HTRF-based cAMP assays remain the gold standard for sensitivity at sub-nanomolar concentrations. For researchers interested in all three receptors in a single experiment, using three separate overexpressing lines in parallel is preferable to a mixed or endogenous expression system where receptor stoichiometry is undefined.
Concentration Series Construction
Given the nearly 100-fold span between the GIPR EC50 (approximately 0.064 nM) and the GCGR EC50 (approximately 5.79 nM), a half-log concentration series starting at 0.001 nM and ending at 100 nM provides adequate coverage. Preparing working dilutions from a high-concentration stock (typically 1 µM in sterile water or compatible buffer) minimizes pipetting error at the low end, which is where GIPR pharmacology lives. Errors of even 20% in pipetting at the 0.01 nM level translate directly into shifted EC50 estimates.
Incubation Time and Temperature
Sixty minutes at room temperature is the standard incubation window for cAMP accumulation assays with this class of peptide. Shortening this window selectively disadvantages the lower-affinity receptor interactions (GCGR in the human system), resulting in an apparently flatter upper curve and underestimation of maximal GCGR activation. Extending incubation beyond 90 minutes without refreshing IBMX can lead to cAMP degradation artifacts in some cell backgrounds.
Comparison: In Vitro Assay Formats for Retatrutide
| Assay Format | Strengths for Retatrutide Research | Key Limitations |
|---|---|---|
| HTRF cAMP Assay (HEK293 overexpressing) | High sensitivity at sub-nanomolar concentrations; quantitative EC50 derivation; validated format for GLP-1R, GIPR, and GCGR individually; suitable for full dose-response curve construction | Requires three separate cell lines to characterize all three receptors; does not capture receptor cross-talk or downstream pathway divergence |
| SEAP Reporter Gene Assay (HEK-Blue lines) | Colorimetric readout reduces equipment requirements; batch validation possible; each lot can be independently confirmed for biological activity at each receptor | Lower sensitivity than HTRF at the sub-0.1 nM range; reporter gene expression variability adds noise to low-concentration data points |
| Primary Tissue Preparation (ex vivo) | Physiologically relevant receptor context; captures native receptor stoichiometry and tissue-specific signal modulation; adds translational weight to concentration-effect data | Highly variable between preparations; species and individual donor differences are significant; not suitable for high-throughput concentration-response screening |
Why Compound Quality Defines Your Dose-Response Curve
This is where the gap between a rigorous dose-response experiment and an unreliable one is almost always decided. Retatrutide is a 39-amino-acid peptide with multiple structural modifications, including non-natural amino acid substitutions (Aib residues) and a C20 fatty diacid side chain that confers its extended half-life. Synthetic impurities, oxidized residues, or degradation products can each occupy receptor binding sites without producing the same cAMP response as the intact compound. The result is not just a lower maximal signal. The dose-response curve develops a shallower Hill slope, a distorted EC50, and in some cases a biphasic shape that researchers mistakenly interpret as genuine receptor biology.
At concentrations below 0.1 nM, where GIPR pharmacology is being characterized, even a 1 to 2% impurity that acts as a partial agonist or competitive binder will meaningfully alter your curve. This is not a theoretical concern. It is a practical one for any lab running concentration-response work in the sub-nanomolar regime.
Research-grade retatrutide intended for in vitro concentration work should carry HPLC verification at 99% or greater purity, batch-specific certificates of analysis, and ideally independent third-party verification rather than just manufacturer-provided data. For Canadian research institutions, chain of custody documentation matters for both regulatory compliance and reproducibility: when a concentration-effect result cannot be replicated, one of the first questions is whether the compound from the second experiment came from a verified batch with documented purity and storage history.
At Pepura Labs, lyophilized retatrutide products are independently verified by Canadian laboratories, with full chain of custody documentation for every batch. That level of traceability is not a marketing detail for in vitro concentration research. It is the difference between a dose-response curve you can publish and one you spend three months trying to reproduce.
Pro tip: Store reconstituted retatrutide in single-use aliquots at -80°C. Each freeze-thaw cycle introduces the possibility of aggregation, which shifts the effective concentration of monomeric, receptor-active peptide in your working solution without changing the total protein content read by a BCA or absorbance assay. Your concentration measurement is intact. Your dose-response curve is not.
Frequently Asked Questions
What concentration range is appropriate for a retatrutide dose-response experiment in HEK293 cells?
For a standard cAMP accumulation assay in HEK293 cells overexpressing human receptors, a range of 0.001 nM to 100 nM with eight or more points on a half-log scale captures all three receptor inflection points. The GIPR response begins below 0.1 nM, GLP-1R activation is half-maximal around 0.775 nM, and GCGR activation is half-maximal around 5.79 nM. Narrower ranges will compress or miss one or more of these pharmacological events.
Why do mouse and human retatrutide dose-response data differ so significantly at GCGR?
The human and mouse glucagon receptor orthologs differ in amino acid sequence, which alters the binding pocket geometry for a peptide ligand like retatrutide. The human GCGR Ki is approximately 5.6 nM, while the mouse GCGR Ki is approximately 73 nM, a greater than tenfold difference. Researchers using murine cell lines or primary mouse tissue need to account for this divergence when designing concentration series or extrapolating results to human receptor pharmacology.
Can endogenous receptor expression in native cell lines substitute for overexpressing systems in retatrutide concentration research?
Endogenous receptor expression levels are typically too low to produce reliable cAMP signals at the sub-nanomolar concentrations where retatrutide GIPR and GLP-1R pharmacology operates. Without receptor overexpression, signal-to-noise becomes the limiting factor well before you can characterize the dose-response relationship with statistical confidence. For clean EC50 derivation, stably transfected overexpressing lines remain the standard approach for this class of compound.
How does peptide purity affect EC50 measurements at low concentrations?
At concentrations below 0.1 nM, which is directly relevant to GIPR characterization, even small percentages of receptor-binding impurities shift the apparent EC50 and distort the Hill slope. Impurities that partially occupy the receptor without triggering full cAMP accumulation act as competitive interference, making the compound appear less potent than it is. This is why 99%-plus HPLC-verified purity is not a premium specification for its own sake. It is a baseline requirement for sub-nanomolar dose-response work to produce interpretable results.
What is the significance of phosphodiesterase inhibition (IBMX) in retatrutide cAMP assays?
Retatrutide raises intracellular cAMP by activating adenylyl cyclase through all three G-protein-coupled receptors. Phosphodiesterases degrade cAMP rapidly in most cell types. Without inhibition of phosphodiesterase activity, cAMP produced at low agonist concentrations is degraded before it can accumulate to a detectable level. Including IBMX at approximately 250 µM in the assay medium is standard practice and is critical for accurately characterizing the lower portion of the dose-response curve, where GIPR and GLP-1R activation dominates.
Is the dose-response relationship for retatrutide linear across all three receptors?
No. Each receptor follows its own sigmoidal dose-response curve, and because the three EC50 values span roughly two orders of magnitude (from approximately 0.064 nM for GIPR to approximately 5.79 nM for GCGR), the composite response measured in a mixed readout is not a simple sigmoid. At concentrations between 0.1 and 1 nM, GLP-1R is the dominant contributor. Below 0.1 nM, GIPR drives most of the signal. Above 1 nM, GCGR begins to contribute meaningfully. Understanding this architecture is essential for interpreting the shape of any curve measured across the full concentration range.
If you are currently designing a retatrutide in vitro concentration study or have encountered unexpected curve shapes in your dose-response data, share your experience or question in the comments. Specific assay contexts and anomalies are worth discussing.
References
- Cayman Chemical product data for retatrutide: EC50 values at human GCGR, GLP-1R, and GIP receptor in HEK293 cell cAMP assays
- PubMed Central: Retatrutide concentration-dependent effects on contractile force in human atrial preparations and cAMP receptor pharmacology data
- InvivoGen: Retatrutide GLP-1R, GIPR, and GCGR agonist biology and reporter gene bioassay validation methodology
- New England Journal of Medicine: Phase 2 clinical data on retatrutide dose-dependent outcomes and mechanistic background of triple receptor agonism