
Researchers designing in vitro studies with retatrutide face a deceptively simple question that turns out to matter enormously: at what point in the compound's action timeline should you expect to see meaningful signal? The retatrutide timeline results emerging from preclinical binding assays, cell-based receptor activation studies, and phase 2 and phase 3 clinical data now paint a clearer picture than was available even two years ago. From early receptor occupancy events measurable within hours of compound exposure, through dose-dependent metabolic readouts accumulating across weeks, to hepatic and glycemic endpoints consolidating at 24 to 48 weeks, the compound's efficacy arc is unusually well-characterized for a molecule still in regulatory review. This article maps that arc precisely, with direct reference to verified research data, so Canadian researchers sourcing high-purity lyophilized retatrutide can design experiments that capture signal at the right timepoints.
Table of Contents
- Quick Takeaways
- Receptor Binding and In Vitro Pharmacology
- Early Timeline: What Preclinical Data Shows
- Phase 2 Efficacy Timeline: The 48-Week Benchmark
- Phase 3 Data: Extending the Timeline to 80 Weeks
- Hepatic Fat and Metabolic Markers Timeline
- Comparison of Retatrutide Dose-Response Profiles
- Implications for In Vitro Research Design
- Frequently Asked Questions
- References
Quick Takeaways
| Key Insight | Explanation |
|---|---|
| Triple receptor agonism is the defining characteristic | Retatrutide (LY3437943) simultaneously activates GIP, GLP-1, and glucagon receptors, producing metabolic effects no single or dual agonist fully replicates in cell-based assays. |
| In vitro potency at GIPR is exceptionally high | Binding affinity profiling shows retatrutide is up to nine times more potent at the human GIP receptor than endogenous GIP itself, a critical variable for receptor saturation experiments. |
| Dose-dependent weight loss signal appears by week 12 in clinical data | Phase 2 data show the compound's body weight impact stratified clearly by dose even at early interim assessments, with 12 mg producing 24.2% reduction at 48 weeks versus 2.1% for placebo. |
| Hepatic fat endpoints consolidate at 24 weeks | Most of the measurable liver fat reduction in clinical substudies occurred within the first 24 weeks, with normal liver fat achieved by 86% of participants on 12 mg by that timepoint. |
| Phase 3 results extend the timeline signal to 80 weeks | TRIUMPH-2 and TRIUMPH-3 demonstrated 20.8% and 22.6% mean weight loss, respectively, at 80 weeks with no plateau observed at the higher doses. |
| Glycemic control timeline is rapid in type 2 diabetes cohorts | TRANSCEND-T2D-1 phase 3 data showed HbA1c reductions of up to 2.0 percentage points versus 0.8% for placebo at 40 weeks, confirming fast glycemic signal onset. |
| Compound purity directly impacts assay reproducibility | For researchers translating published dose-response curves into in vitro protocols, starting material purity of 99% or greater is not optional - it is the precondition for interpretable results. |
Receptor Binding and In Vitro Pharmacology
The timeline for any retatrutide study begins at the molecular level. Before cell viability, before metabolic readouts, before any observable phenotype, there is receptor binding. In vitro pharmacological and binding affinity profiling establishes that retatrutide carries disproportionately high activity at the human GIP receptor, reaching up to nine times the potency of the endogenous GIP ligand itself, while its activity at GLP-1 and glucagon receptors is balanced but slightly below their respective native ligands. This asymmetry is not incidental. It reflects deliberate structural engineering: the compound's 39-amino acid backbone was derived from a GIP template and then systematically mutated to incorporate recognition motifs homologous to both GLP-1 and glucagon.
For researchers running receptor activation assays, this profile has direct implications. Saturating GIPR in an in vitro system requires far lower molar concentrations of retatrutide than saturating GLP-1R or GCGR. Assay designs that treat all three arms of the receptor activation profile as equivalent will underestimate GIP-pathway contributions and over-attribute effects to GLP-1 signaling. The compound's signal transduction proceeds through Class B1 G protein-coupled receptor mechanisms, where the C-terminal peptide segment forms an amphipathic alpha-helix engaging the extracellular domain, while the N-terminal segment inserts into the transmembrane bundle to initiate signaling.
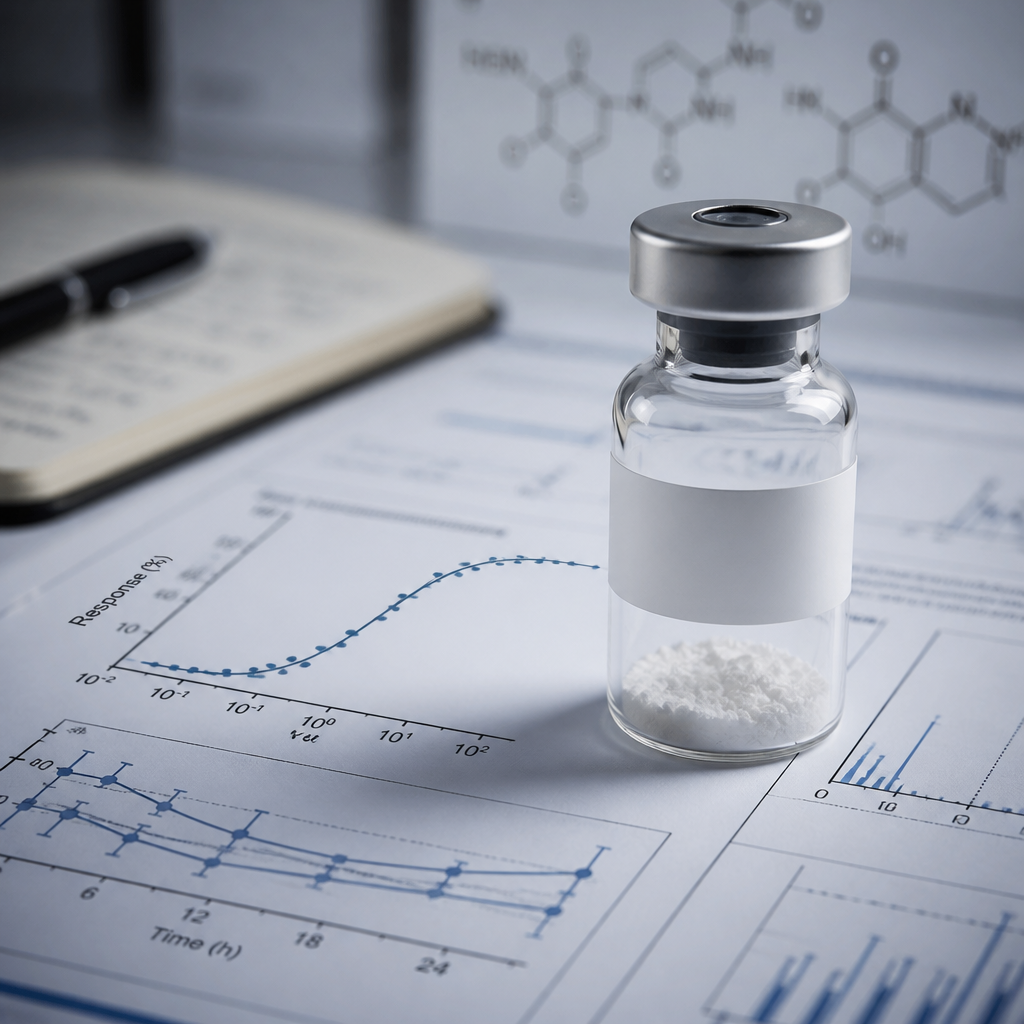
Pro tip: When designing in vitro dose-response curves for retatrutide, include at minimum a three-order-of-magnitude concentration range. The compound's differential receptor potencies mean that effects at nanomolar concentrations may reflect predominantly GIPR activity, while the full triple-agonist profile requires concentrations sufficient to engage all three receptor types simultaneously.

Early Timeline: What Preclinical Data Shows
Preclinical pharmacology work with LY3437943 in animal models established the foundational timeline benchmarks that in vitro researchers now work against. In diet-induced obese (DIO) mouse models, body weight reduction was primarily due to loss of fat mass and was associated with lowered total plasma cholesterol and reduced liver fat content. Importantly, preclinical models also showed that the compound produced greater glucose-dependent insulin secretion compared with existing GLP-1 receptor agonists, as demonstrated by intravenous glucose tolerance tests in rats.
Gastric Emptying and Appetite Suppression Signals
Animal studies document retatrutide's ability to delay gastric emptying and reduce food intake, with superior efficacy compared to other incretin-based therapies tested in the same models. These are not slow-onset effects. Gastric motility changes are among the earliest observable functional signals in in vivo models, and they set the timeline expectation for researchers working with gastrointestinal cell lines or motility assays in vitro: expect receptor-mediated cAMP signaling events to be measurable within hours, not days.
Energy Expenditure: The Glucagon Receptor Contribution
The glucagon receptor component of retatrutide's mechanism adds a dimension absent from single or dual incretin agonists: direct promotion of hepatic fat oxidation and elevated energy expenditure. In preclinical models, weight reduction was augmented by glucagon receptor-mediated increases in energy expenditure layered on top of GIPR and GLP-1R driven appetite suppression. This means in vitro researchers studying hepatocyte fat handling or oxidative metabolism should expect retatrutide to produce different signal patterns than a GLP-1 agonist alone, particularly in assays involving fatty acid oxidation readouts.
Retatrutide's unique molecular structure enables potent activation of GLP-1, GIP, and glucagon receptors simultaneously, leading to metabolic outcomes that no single-receptor or dual-receptor agonist fully replicates in preclinical models.
Phase 2 Efficacy Timeline: The 48-Week Benchmark
The published Phase 2 obesity trial (a randomized, double-blind, placebo-controlled study) remains the most detailed source of dose-stratified timeline data for retatrutide efficacy. At 48 weeks, the least-squares mean percentage change in body weight was -8.7% in the 1 mg group, -17.1% in the combined 4 mg group, -22.8% in the combined 8 mg group, and -24.2% in the 12 mg group, compared with -2.1% in the placebo group. These are not endpoint snapshots. The trial's interim assessments reveal that dose-dependent separation was observable well before week 48, providing researchers with a gradient of expected response across the timeline.
Threshold Response Rates by Dose
Beyond mean weight loss, the phase 2 data report threshold response rates that matter for in vitro research calibration. At 48 weeks, a weight reduction of 5% or more, 10% or more, and 15% or more had occurred in 92%, 75%, and 60%, respectively, of participants receiving 4 mg. Among participants receiving 8 mg, those thresholds were met by 100%, 91%, and 75%. At 12 mg, the corresponding figures were 100%, 93%, and 83%. For researchers designing assays that need to capture effect at a specific magnitude threshold, these distributions define the realistic expected signal ranges.
Pharmacokinetics Shaping the In Vitro Dosing Interval
The pharmacokinetics of retatrutide are dose-proportional, with a half-life of approximately 6 days. This enables once-weekly subcutaneous administration in clinical studies. For in vitro protocols, this half-life has a different implication: the compound is remarkably stable under physiological conditions, which reduces concerns about compound degradation confounding time-course assays. Researchers running multi-day cell exposure experiments benefit from this stability, but should still validate compound concentration at each timepoint in longer assay windows.
Pro tip: For in vitro studies replicating clinical dose-equivalent concentrations, calculate your working concentrations from verified molecular weight data on the lyophilized batch you are using. Retatrutide's 39-amino acid structure means even small lot-to-lot purity variations will shift your effective molar concentration significantly if you are dosing by mass rather than by moles.
Phase 3 Data: Extending the Timeline to 80 Weeks
The TRIUMPH-2 and TRIUMPH-3 phase 3 trials extended the efficacy timeline beyond the 48-week phase 2 benchmark and confirmed that weight loss does not plateau at higher doses. TRIUMPH-2 (n=1,152) showed 12.7% to 20.8% mean weight loss across 4 to 12 mg versus 4.0% with placebo at 80 weeks. TRIUMPH-3 (n=1,949) demonstrated 21.6% to 22.6% mean weight loss with 9 to 12 mg versus 3.2% with placebo. Critically, the absence of a plateau signal at 80 weeks in the 12 mg arm distinguishes retatrutide's timeline profile from compounds where efficacy curves flatten well before that duration.
The TRIUMPH-4 trial, which evaluated retatrutide in adults with obesity and knee osteoarthritis, reported that participants taking retatrutide 12 mg lost an average of 28.7% of body weight at 68 weeks, meeting all primary and key secondary endpoints. Both doses evaluated (9 mg and 12 mg) met all primary and key secondary endpoints. These results support the understanding that the compound's efficacy signal, at research-grade concentrations, continues accumulating well past the timescales typical of shorter-duration in vitro studies.
Hepatic Fat and Metabolic Markers Timeline
One of the most consistently reported and mechanistically informative aspects of the retatrutide timeline is the hepatic fat reduction signal. A 48-week phase 2 substudy in participants with metabolic dysfunction-associated steatotic liver disease (MASLD) found that most of the reduction in liver fat occurred within the first 24 weeks. Mean relative change from baseline in liver fat at 24 weeks was -42.9% with 1 mg, -57.0% with 4 mg, -81.4% with 8 mg, and -82.4% with 12 mg, compared with +0.3% in the placebo group, with all active-dose results statistically significant versus placebo.
Normalization Rates at 24 Weeks
Normal liver fat content (defined as below 5%) was achieved by 27% of participants on 1 mg, 52% on 4 mg, 79% on 8 mg, and 86% on 12 mg at 24 weeks. Zero participants in the placebo group achieved this threshold. For researchers using hepatocyte cell models to study steatosis reversal, these rates define the window within which the glucagon receptor-mediated hepatic fat oxidation mechanism becomes functionally dominant. The 24-week timepoint is where in vitro hepatic assays should expect maximal differentiation between dose groups, not at 48 weeks, because much of the hepatic signal consolidates early.
Glycemic Control Timeline in Type 2 Diabetes Models
The TRANSCEND-T2D-1 phase 3 trial enrolled 537 adults with a mean baseline HbA1c of 7.9% and mean BMI of 35.8, randomized to retatrutide 4 mg, 9 mg, 12 mg, or placebo. HbA1c reductions of 1.7%, 2.0%, and 1.9% were observed with 4 mg, 9 mg, and 12 mg respectively, versus 0.8% with placebo at 40 weeks, meeting superiority for the primary endpoint. Mean weight loss reached 16.8% at 12 mg by week 40, without evidence of plateau. These glycemic timelines are faster than typical for weight-loss-adjacent compounds, reflecting the direct incretin-mediated insulin secretion pathway alongside the weight-dependent glucose normalization effects.
Comparison of Retatrutide Dose-Response Profiles
Translating clinical dose-response data into in vitro research context requires understanding how different dose levels produce qualitatively different patterns, not just quantitatively larger effects. The table below summarizes the verified efficacy data across three primary dose levels from phase 2 trial data, the most granular source currently available for this kind of stratification.
| Dose Level | Body Weight Change at 48 Weeks (Phase 2) | Liver Fat Change at 24 Weeks (MASLD Substudy) |
|---|---|---|
| 4 mg (combined) | -17.1% mean; 92% achieved >5% reduction, 75% achieved >10% | -57.0% mean relative change; 52% achieved normal liver fat (<5%) |
| 8 mg (combined) | -22.8% mean; 100% achieved >5% reduction, 91% achieved >10% | -81.4% mean relative change; 79% achieved normal liver fat (<5%) |
| 12 mg | -24.2% mean; 100% achieved >5% reduction, 93% achieved >10% | -82.4% mean relative change; 86% achieved normal liver fat (<5%) |
What this table reveals is that the 8 mg and 12 mg arms produce statistically similar hepatic fat outcomes at 24 weeks, while their body weight separation is more pronounced at 48 weeks. This has a direct implication for research design: if your primary endpoint is a hepatic fat-related readout, you are not gaining substantially more signal at the highest concentration compared to a moderately high one, and the cost and complexity of running multiple concentration arms may not be justified for hepatic assays alone.
Implications for In Vitro Research Design
Translating a compound with this kind of multi-endpoint, multi-timepoint efficacy profile into a rigorous in vitro study requires decisions that go beyond simply picking a concentration and a cell line. The verified data on retatrutide's timeline creates specific design constraints that researchers in Canadian institutions should factor in from the protocol stage.
Matching Assay Windows to the Right Efficacy Phase
The compound operates across at least three mechanistically distinct phases: rapid receptor binding and cAMP signaling within hours, functional appetite and gastric motility-related pathway activation over days, and cumulative metabolic endpoint consolidation over weeks to months. A 72-hour in vitro assay will capture the first phase clearly but will not reflect the trajectory of the hepatic fat or glycemic endpoints that dominate the clinical literature. Researchers should explicitly state which phase of the compound's action they are studying, and design assay duration accordingly.
Purity Requirements for Reproducible Dose-Response Curves
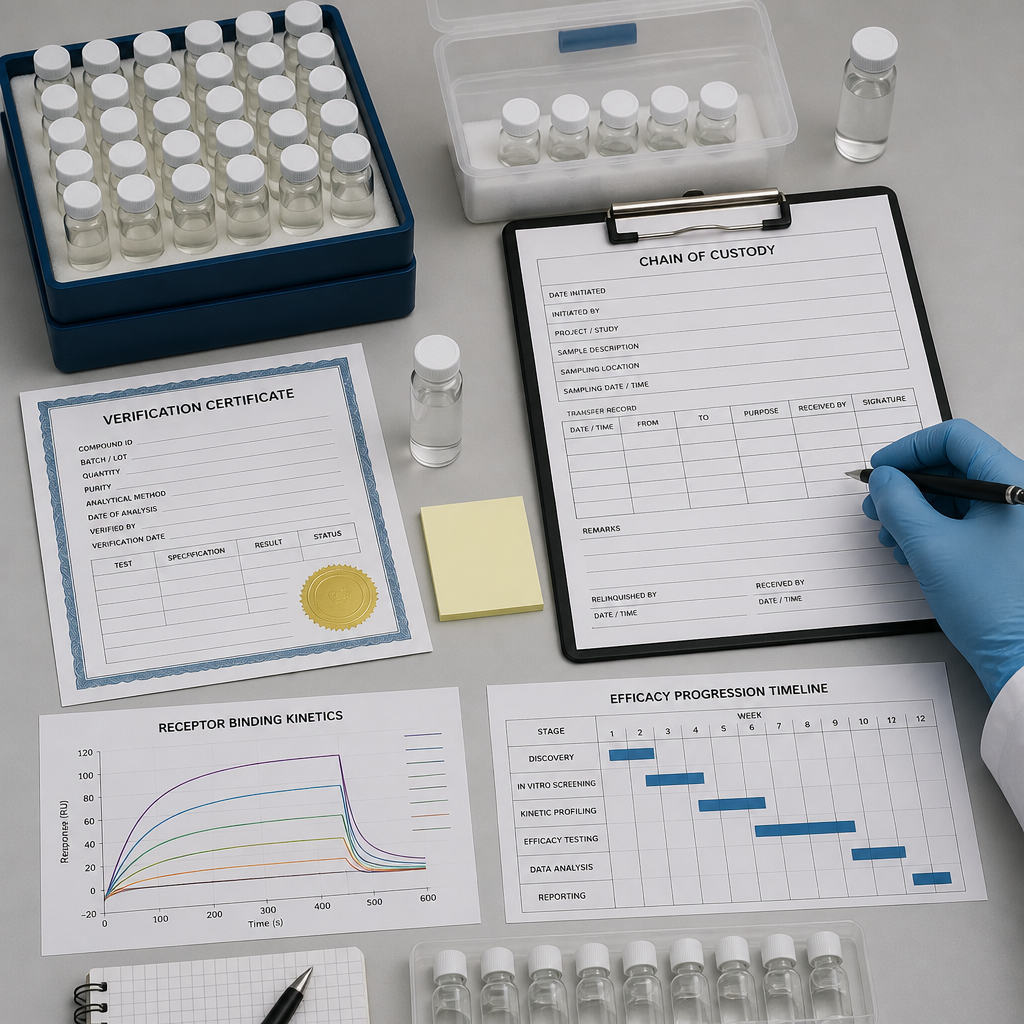
Every dose-response relationship described in the published clinical and preclinical literature assumes a compound of defined purity used at calibrated concentrations. When sourcing retatrutide for in vitro research in Canada, independently verified purity documentation is not a formality. Batch-to-batch variability in lyophilized peptide preparations can shift the effective concentration of active compound by a meaningful margin, compressing or expanding the dose-response window relative to published benchmarks. Pepura Labs provides batch-specific chain of custody documentation and Canadian laboratory verification precisely because these details determine whether your results can be compared against published data or are only internally interpretable.
Pro tip: Always reconstitute lyophilized retatrutide using bacteriostatic water rather than standard sterile water for stock solutions intended for multi-use in vitro protocols. Bacteriostatic water's antimicrobial agent extends the usable life of your working stock, which is especially important for longer assay timelines where contamination of the stock solution is a realistic threat to data integrity.
Selecting the Right Compound Format for Your Protocol
Pepura Labs offers retatrutide compound in 10 mg, 20 mg, 40 mg, and higher-quantity formats including 60 mg and 84 mg sizes. Smaller formats suit early-stage dose-response characterization and receptor binding assays; larger formats support multi-week cell culture experiments where you need consistent compound from a single verified batch across the entire study timeline. Switching batches mid-study introduces the exact confound that independent laboratory verification is designed to prevent.
Frequently Asked Questions
What is the earliest timepoint at which retatrutide shows measurable receptor activity in cell-based assays?
Receptor activation via cAMP signaling pathways at GIP, GLP-1, and glucagon receptors occurs within hours of compound exposure in cell-based systems. The compound binds Class B1 GPCRs through a well-characterized two-domain mechanism, and intracellular second-messenger responses can be measured within the same assay session as compound addition. The early timeline is dominated by receptor occupancy and signal transduction events, not by the downstream metabolic changes that take weeks in clinical studies.
How does the retatrutide timeline differ from single-receptor GLP-1 agonists in in vitro research?
The critical difference is the hepatic component driven by the glucagon receptor. Single GLP-1 agonists do not produce the direct hepatic fat oxidation signal that retatrutide generates. In vitro hepatocyte assays will show mechanistically distinct responses to retatrutide compared to a GLP-1-only compound, particularly in fatty acid oxidation readouts. Additionally, because retatrutide is up to nine times more potent at GIPR than endogenous GIP, the insulin secretion signal in pancreatic cell models will be qualitatively different from what a GLP-1 agonist alone produces.
What does the phase 2 data tell researchers about which dose to model in in vitro studies?
The 8 mg and 12 mg arms in the phase 2 trial produced the clearest separation from placebo across both body weight and hepatic fat endpoints. For researchers trying to model the compound's full efficacy profile, concentrations that translate to these higher clinical dose equivalents will capture the most complete signal across all three receptor systems. Lower concentrations, corresponding to the 1 mg arm, produced an -8.7% body weight effect at 48 weeks and a -42.9% liver fat reduction at 24 weeks: smaller but still statistically significant signals that are appropriate for sensitivity or threshold-detection assays.
Why does compound purity matter for replicating published retatrutide timeline results?
Published dose-response data were generated with characterized compounds at defined purity levels. If a research batch contains 95% active compound rather than 99%+, your actual molar concentration of active compound at any given nominal dose is lower than intended. This compresses your dose-response curve relative to the published reference. Over a multi-week assay, this systematic offset accumulates and can make your results appear inconsistent with the literature even when your methodology is sound. Independent laboratory verification of each batch eliminates this variable before you begin.
What metabolic endpoints beyond weight loss should researchers track when studying retatrutide across a multi-week in vitro timeline?
The published research points to four categories beyond body weight: hepatic fat content (most signal at 24 weeks), glycemic markers including insulin secretion and HbA1c-equivalent readouts in glucose-challenged cell models, lipid-related endpoints (non-HDL cholesterol and triglyceride effects are documented in phase 3 data), and inflammatory markers including hsCRP, which showed improvements in the TRIUMPH-3 population. Each category has a different peak-signal timepoint, and a well-designed study should include assay windows matched to each rather than a single endpoint measured at a single time.
Is bacteriostatic water necessary for reconstituting retatrutide, or is sterile water sufficient?
For single-use reconstitution in a same-session assay, sterile water is sufficient. For working stocks that will be used across multiple experimental sessions spanning days or weeks, bacteriostatic water is the better choice because it prevents microbial growth in the reconstituted peptide solution. Given that retatrutide has a documented half-life of approximately 6 days under physiological conditions, a properly prepared and stored stock solution in bacteriostatic water can remain stable across a multi-week in vitro protocol without requiring fresh reconstitution at each use.
If you are currently designing a retatrutide in vitro study or interpreting timeline data from an ongoing experiment, share your protocol questions or observations in the comments. Your experience with specific cell models, assay windows, or dose-response patterns helps the Canadian research community refine its collective understanding of this compound.
We would love your feedback and any insights you would share with others. What perspective would you add?
References
- Phase 2 clinical trial data on triple-hormone-receptor agonist retatrutide for obesity, published in the New England Journal of Medicine
- Retatrutide substudy on hepatic fat reduction in MASLD participants, published via PubMed Central
- Comprehensive review of retatrutide mechanisms, efficacy, and safety profile across preclinical and clinical studies, via PubMed Central
- Summary of TRIUMPH-2 and TRIUMPH-3 Phase 3 trial results showing up to 22.6% weight loss, via Pharmaceutical Executive
- Phase 3 TRANSCEND-T2D-1 trial findings on retatrutide efficacy and safety in type 2 diabetes, via PubMed