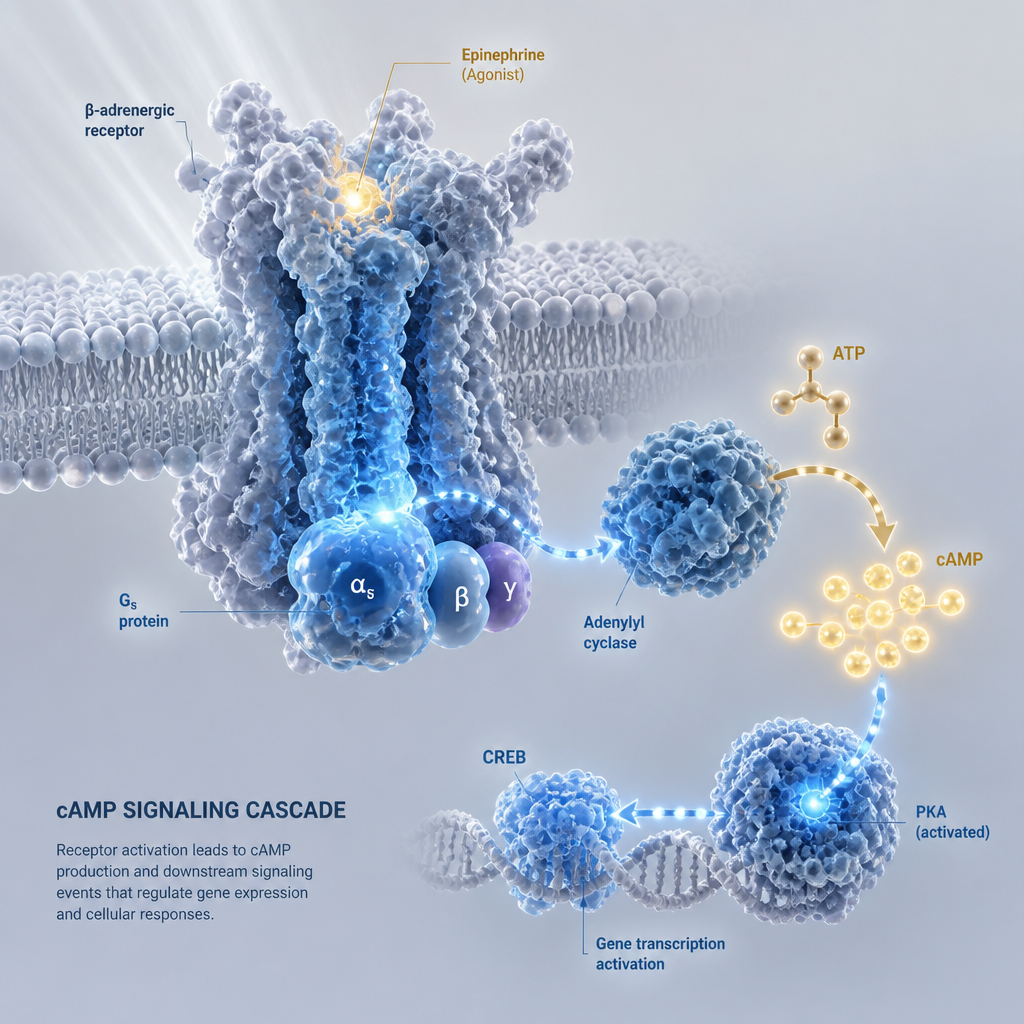
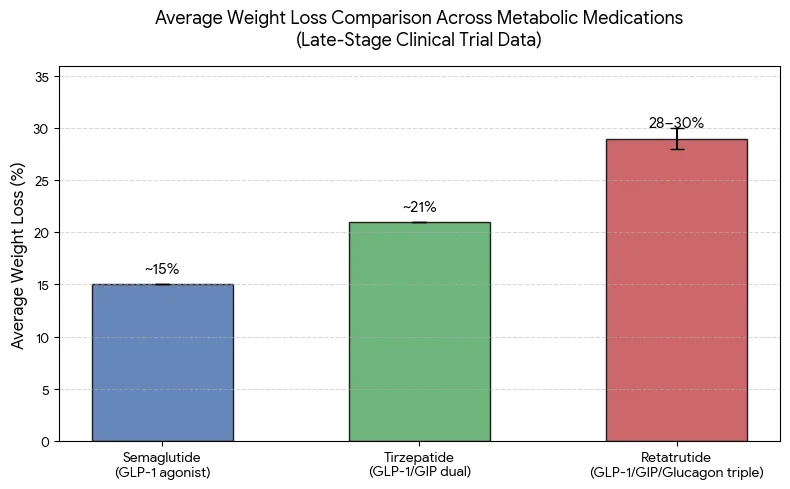
A triple agonist that engages the GIP, GLP-1, and glucagon receptors looks simple on a slide and gets messy at the bench. GLP-1 pathway activity has been linked to higher mitochondrial mass in pancreatic beta-cell models, while glucagon signaling pulls hepatic mitochondrial biology in a different direction. When a team sets up a mitochondrial biogenesis assay to separate those signals, the study design decides whether the result means anything. This guide covers the choices researchers most often get wrong, from cell model selection to the readouts that hold up under review, using retatrutide in vitro work as the working example.
Table of Contents
- Quick Takeaways
- Why Mitochondrial Biogenesis Is a Fair Readout for Triple Agonists
- Choosing a Cell Model That Can Answer the Question
- Separating Glucagon Receptor Signaling from GLP-1 Effects
- PGC-1α as a Signal, Not the Verdict
- Functional Readouts: Membrane Potential and Respiration
- Comparing Common Assay Approaches
- Controls, Compound Sourcing, and Documentation
- Frequently Asked Questions
- References
Quick Takeaways
| Key Insight | Explanation |
|---|---|
| Confirm receptor expression in your cell model | Glucagon and GLP-1 receptor levels vary between lines and passages, so verify them before reading any biogenesis signal. |
| Run single-receptor reference agonists alongside the triple agonist | Without a GLP-1-only and a glucagon-only arm, you cannot attribute a mitochondrial effect to one part of the triple agonist's activity. |
| Write a predicted direction for each receptor arm | Glucagon can suppress hepatic biogenesis markers, so a flat or falling glucagon arm is a meaningful result if you predicted it. |
| Treat PGC-1α as an early signal, not the endpoint | Coactivator transcription can rise without new mitochondria, so pair it with a direct mass measurement. |
| Measure function as well as mass | Membrane potential and oxygen consumption show whether added mitochondria actually work, and they should agree with your mass data. |
| Document the lot, purity, and certificate of analysis for every run | Batch-to-batch differences can look like a biological effect, and traceability is the only way to rule them out. |
Why Mitochondrial Biogenesis Is a Fair Readout for Triple Agonists
The case for measuring mitochondrial biogenesis starts with a published observation. In a study of INS-1 rat insulinoma cells, GLP-1 and exendin-4 each increased mitochondrial mass by approximately 20% after 48 hours of treatment. The authors built their hypothesis on the idea that mitochondrial function is central to insulin secretion, which made beta cells a logical first test system.

Retatrutide is a triple agonist of GIP, GLP-1, and glucagon receptors, so the GLP-1 story is only one part of the question. Glucagon has its own documented effects on mitochondria. One source notes that glucagon tends to reduce hepatic mitochondrial biogenesis by attenuating NRF1, TFAM, and MFN2 expression, a process mediated by FOXO1. A biogenesis assay on a triple agonist is therefore not guaranteed to move in one direction, and a good design has to show which arm is driving the result.
Pro tip: Write the predicted direction for each receptor arm before you order the compound. A biogenesis result with no prediction attached is very hard to interpret after the fact.
Single-endpoint studies are where most interpretation problems start. A mass increase without a functional change may reflect a cell-stress response, and a functional gain without mass change may reflect altered respiration in existing organelles. Plan at least two readouts from the start so the data can be checked against each other.
Choosing a Cell Model That Can Answer the Question
Insulinoma lines versus primary cells
INS-1 cells are a practical starting point because the published GLP-1 work used them, which gives you a benchmark to compare against. They are a clonal rat line, so they describe a beta-cell-like context. They do not describe the hepatic or adipose tissue where glucagon signaling carries much of its metabolic weight. A model that answers only the beta-cell question will leave the glucagon arm largely untested.
Primary hepatocytes express glucagon receptors in a context that makes that arm easier to probe. They are harder to keep stable across a 48-hour window, and donor variation adds noise. Expect to run more replicates and build the donor effect into your analysis plan.
Confirm receptor expression before you run the assay
Do not assume a receptor is present just because the cell type is supposed to carry it. Confirm GCGR and GLP1R expression by qPCR or a validated antibody, and record the passage number for every experiment. A line that loses receptor expression over several passages produces a biogenesis result that reflects a different experiment than the one you wrote down.
Separating Glucagon Receptor Signaling from GLP-1 Effects
The cleanest design uses at least three arms: vehicle, a GLP-1 receptor reference agonist, and a glucagon receptor reference agonist, run alongside the triple agonist. If the triple agonist effect differs from the GLP-1 arm alone, you have a testable hypothesis about the glucagon or GIP contribution. Without that comparison, a 20% mass increase is just a number on a plot.
Building the comparator set
Choose reference ligands with documented receptor selectivity. Run each one across a concentration range that brackets the effective window you measured in your own cAMP or binding assays. Matching potency matters more than matching nominal concentration. If your budget allows a GIP-only arm, add it, since a 2026 review of GLP-1 receptor agonists notes emerging evidence that GIP receptor activation may influence mitochondrial biogenesis, cellular bioenergetics, and oxidative stress.
Reading the direction of the glucagon effect
Because glucagon's documented effect on hepatic biogenesis is suppressive, a glucagon-driven arm may blunt a readout you expected to rise. Write that prediction down before the run. A flat or negative glucagon-arm result is a finding, not a failed experiment.
A flat result on one receptor arm is still data. In a triple-agonist study, it is often the most informative data you will collect.
PGC-1α as a Signal, Not the Verdict
PGC-1α, or peroxisome proliferator-activated receptor-gamma coactivator 1 alpha, is the transcriptional coactivator most often used as an early biogenesis marker. In the INS-1 study, GLP-1 and exendin-4 increased its expression roughly 2-fold, which gives a sensible expected magnitude for a similar system. Transcript measurements are fast and inexpensive, which is why they dominate early screens.
The problem is that PGC-1α is a coactivator. Its mRNA or protein rising does not prove that new mitochondria were built. Pair it with a direct mass measurement, such as a mitochondrial-to-cytosolic ratio or a mitochondria-targeted dye, and with at least one downstream transcript such as NRF1 or TFAM.
Timing the readout around 48 hours
The published work used a 48-hour exposure, which is a sensible anchor for pilot designs. Structural changes in mitochondria generally lag behind transcriptional changes. Run an earlier timepoint for PGC-1α and a later one for mass. Otherwise you may read a transient transcriptional spike as a structural gain, or miss a late structural change entirely.
Pro tip: Harvest RNA and fix cells from the same wells at the same time. Splitting groups across different days introduces a batch effect that can look like a glucagon response.
Functional Readouts: Membrane Potential and Respiration
The INS-1 study reported that GLP-1 increased mitochondrial membrane potential and oxygen consumption, not only mitochondrial mass. Functional readouts answer a different question: whether the mitochondria present are doing useful work. A design that includes both structural and functional data gives you a much stronger basis for interpreting a triple-agonist effect.
Membrane potential dyes
Fluorescent potentiometric dyes such as TMRM are common choices for membrane potential work. Their signal depends on loading time, cell density, and dye concentration, since high dye levels can quench the fluorescence you are trying to read. Include a protonophore depolarization control on every plate so you can confirm the assay window is real.
Oxygen consumption and what it can and cannot tell you
Respirometry gives you a functional readout that mass measurements cannot provide. Oxygen consumption rate reflects mitochondrial respiration along with any other oxygen-consuming processes in the well. A common mistake is reporting raw rates from wells with unequal cell numbers. Normalize to protein or cell count after the run, and keep seeding density identical across arms.
Comparing Common Assay Approaches
No single method answers every question in a triple-agonist study. The table below compares four approaches that appear in biogenesis and bioenergetics work, along with the situations where each one earns its place and where it fails.
| Assay Approach | Best Use in Triple-Agonist Studies | Main Limitation |
|---|---|---|
| Mitochondrial mass ratio (mitochondrial-to-cytosolic measurement) | Direct structural readout that matches the design of the published INS-1 study | Labor-intensive and low throughput for large dose-response series |
| PGC-1α and NRF1/TFAM transcript panel by qPCR | Fast early screen with multiple timepoints at low cost | Transcript change does not confirm new mitochondria |
| Membrane potential dye with a protonophore control | Functional readout that scales well to a plate format | Sensitive to dye loading, cell density, and dye concentration |
| Oxygen consumption rate measurement | Direct measure of respiratory function across arms | Requires normalization and specialized equipment, and reflects whole-well oxygen use |
In practice, most teams start with the transcript panel for breadth, then move to mass and function for the arms that show a real difference. Running all four on every condition is rarely necessary and often wastes material.
Controls, Compound Sourcing, and Documentation
Vehicle and reference controls
Every plate needs a vehicle control, the reference GLP-1 and glucagon agonists, and a positive control for each readout. Bacteriostatic Water is the diluent we supply for lyophilized peptides, so use an identical bacteriostatic water vehicle when you reconstitute the compound. Mismatched diluent is an easy confound to miss when a result looks unexpected.

Certificates of analysis and lot traceability
A triple-agonist result is only as reliable as the compound behind it. Pepura Labs supplies high-purity (99%+) lyophilized Retatrutide in 10 mg, 20 mg, 40 mg, 60 mg, and 84 mg presentations. Each batch is supported by independent Canadian laboratory testing and certificate of analysis documentation. Record the lot number alongside every experiment in your notebook, and check the certificate of analysis against your own analysis when a dose-response shifts.
Store aliquots from each lot separately and avoid repeated freeze-thaw cycles. Keeping a reconstitution log, with date, diluent, and storage conditions, takes a few minutes per run and saves hours of troubleshooting later.
Pro tip: If a dose-response shifts between two lots, check the certificate of analysis and your reconstitution records before you revise the biology.
Frequently Asked Questions
Why is PGC-1α alone not enough for a mitochondrial biogenesis assay?
PGC-1α is a transcriptional coactivator, so its expression can rise without a corresponding increase in mitochondrial mass or function. A credible design pairs it with a direct structural measurement, such as a mitochondrial-to-cytosolic ratio, and at least one functional readout.
Which cell model should I start with for glucagon receptor research?
Start with a model that expresses the glucagon receptor at confirmed levels and that matches the tissue question you are asking. INS-1 cells are useful for benchmarking against published GLP-1 work, but they do not capture hepatic glucagon biology, so plan a second model for that arm.
How long should a biogenesis exposure run?
The published INS-1 work used 48 hours, which is a reasonable anchor for pilot studies. Run earlier timepoints for transcript markers and later timepoints for structural changes, since mitochondrial mass lags behind transcription.
Do I need GLP-1 and glucagon reference agonists in every experiment?
You need them in any experiment where you intend to attribute an effect to one receptor arm. If you only want to confirm that the triple agonist changes a readout, a vehicle and a positive control may be enough, but the interpretation will stay limited.
What documentation should accompany a research peptide lot?
At minimum, record the lot number, purity from the certificate of analysis, diluent, reconstitution date, and storage history. Independent laboratory testing and batch traceability make it possible to separate a compound effect from a batch effect when results change between runs.
Which readout has given your team the cleanest separation between receptor arms, and what broke first when you tried to run it?
References
- Full-text study on GLP-1 and exendin-4 effects on mitochondrial mass in INS-1 cells
- Journal record for the GLP-1 mitochondrial biogenesis study in INS-1 cells
- 2026 review of the direct cellular effects of GLP-1 receptor agonists
- Reference on glucagon regulation of hepatic mitochondrial function and biogenesis